On our platform leadsquantum.com, we provide in-depth analysis of more than 1 million online stores.
One part of our platform is focused on analysis of products. We researched 32 million products, grouped into 60k product groups.
For each product we determine a host of metrics, including:
- search trends,
- search volumes,
- openpagerank of rankings for keyword (to estimate difficulty of ranking for product keyword),
- average domain age of rankings,
- which verticals the product belongs to, and more.
Based on these metrics, we compute opportunity ratings for 60,000+ main product groups.
Using the platform, our users can do a lot of interesting analysis.
1. High ticket product ideas – research 60,000 product groups with 32 million products
An important task of store owner is looking for new products to sell. Among possible ones, those with higher prices are especially attractive as they often come with higher margins.
We have categorized 32 million products based on our eCommerce taxonomy (with three tiers of categories, highest one including 1321 categories).
Let us select Tier 2 category of “Electronics”:
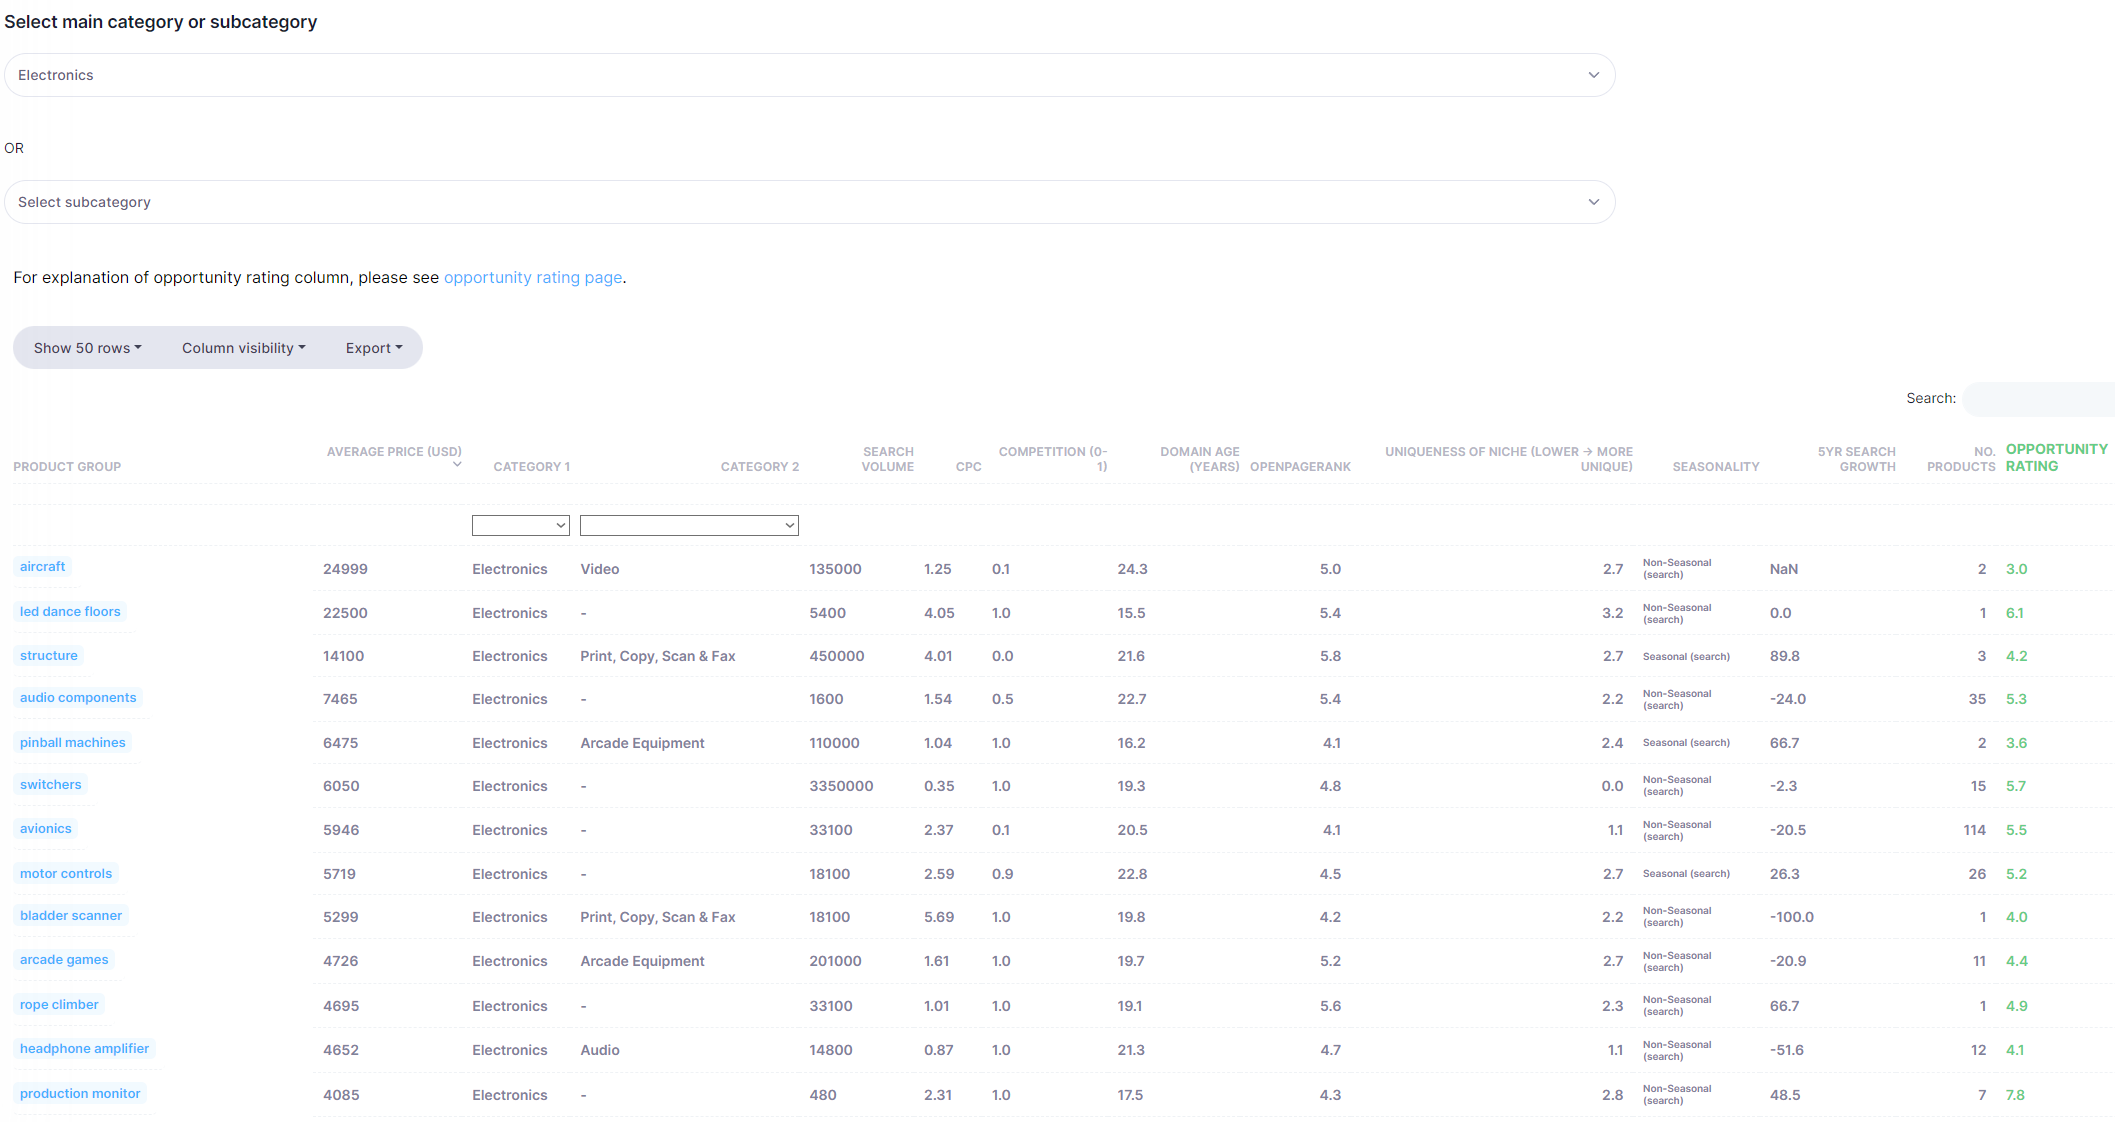
We get a list of all product groups in this category, together with a host of metrics for them (see Appendix for explanation on each quantity).
By ordering with respect to price, one can find a lot of interesting high ticket product group ideas in this vertical.
In addition to common ones like pinball machines, laptops, smart TVs, one also find many interesting and unique ones, adding a few examples of those:
- led dance floors
- restaurant paging system
- price computing scales
- cellular signal boosters
- blindspot detection
- studio lighting controls
- model airplane kit
2. Find high ticket product ideas in any vertical by researching stores
Another way of finding high ticket product ideas is by using our stores search.
Let us say that you are interested in the vertical Animals & Pet Supplies, you select this category from the dropdown menu, filtering country to US and then ordering by price (which will be in USD):

Checking out the top listed domains, one can see they are offering interesting products with high prices for pets and animals, among others:
- Colorfalls
- Designer crates and luxury dog beds
- Complex furniture for pets
- Modern rimless aquariums
- Advanced pet strollers
- Luxury pet car seats
- and many more
There are other ways to find new product ideas, we invite you to check out our how to guides
How to we compute opportunity rating for each product group?
Opportunity rating of a product group measures its opportunity, based on simultaneous consideration of the following factors:
- average price of products in the group (the higher the price, the higher the opportunity)
- search volume of product (the higher the search volume, the higher the opportunity)
- average domain age of top ranked pages for product group as keyword, on google.com (the lower the domain age, the higher the opportunity, as it indicates a young niche)
- average open page rank or domain authority, of top ranked pages for product group as keyword, on google.com (the lower the open page rank or domain authority, the higher the opportunity, as it indicates a niche that is less difficult to rank in)
- 5 year trend of search volume (the higher the growth in search interest for product group, the higher the opportunity)
- uniqueness of product group (the lower the score, higher the uniqueness, the higher the opportunity)
- seasonality of product group (products that are not seasonal present a higher opportunity)
- CPC (the lower the CPC, the higher the opportunity)
- competition (the lower the competition, the higher the opportunity)
Value of each factor listed above is converted to respective z-score and then the opportunity rating is computed as a weighted average of these z-scores. Weights are not equal, but are based on the relative importance of each factor. The relative weights are as follows:
- – search volume: 1.0
- – CPC: 1.0
- – domain age: -1.5
- – open page rank: -1.5
- – uniqueness: -0.5
- – seasonality: -0.5
- – 5 year trend: 1.5
- – average price: 1.0