
Our platform is a powerful hub of many tools and features that can greatly improve your eCommerce, Lead Marketing, Niche Research and other efforts.
For new users, our platform can be a bit daunting.
This is why we have developed a guide with 10 practical use cases that you can try out right away to start seeing results.
These use cases are designed to provide immediate value, and we hope you find them helpful,
please find them here:
Every business owner wants to know what their competitors are doing.
On our platform, we provide several ways to analyze competitors and see which stores are making waves on your category.
You can search for stores by either selecting specific category or search by keyword.
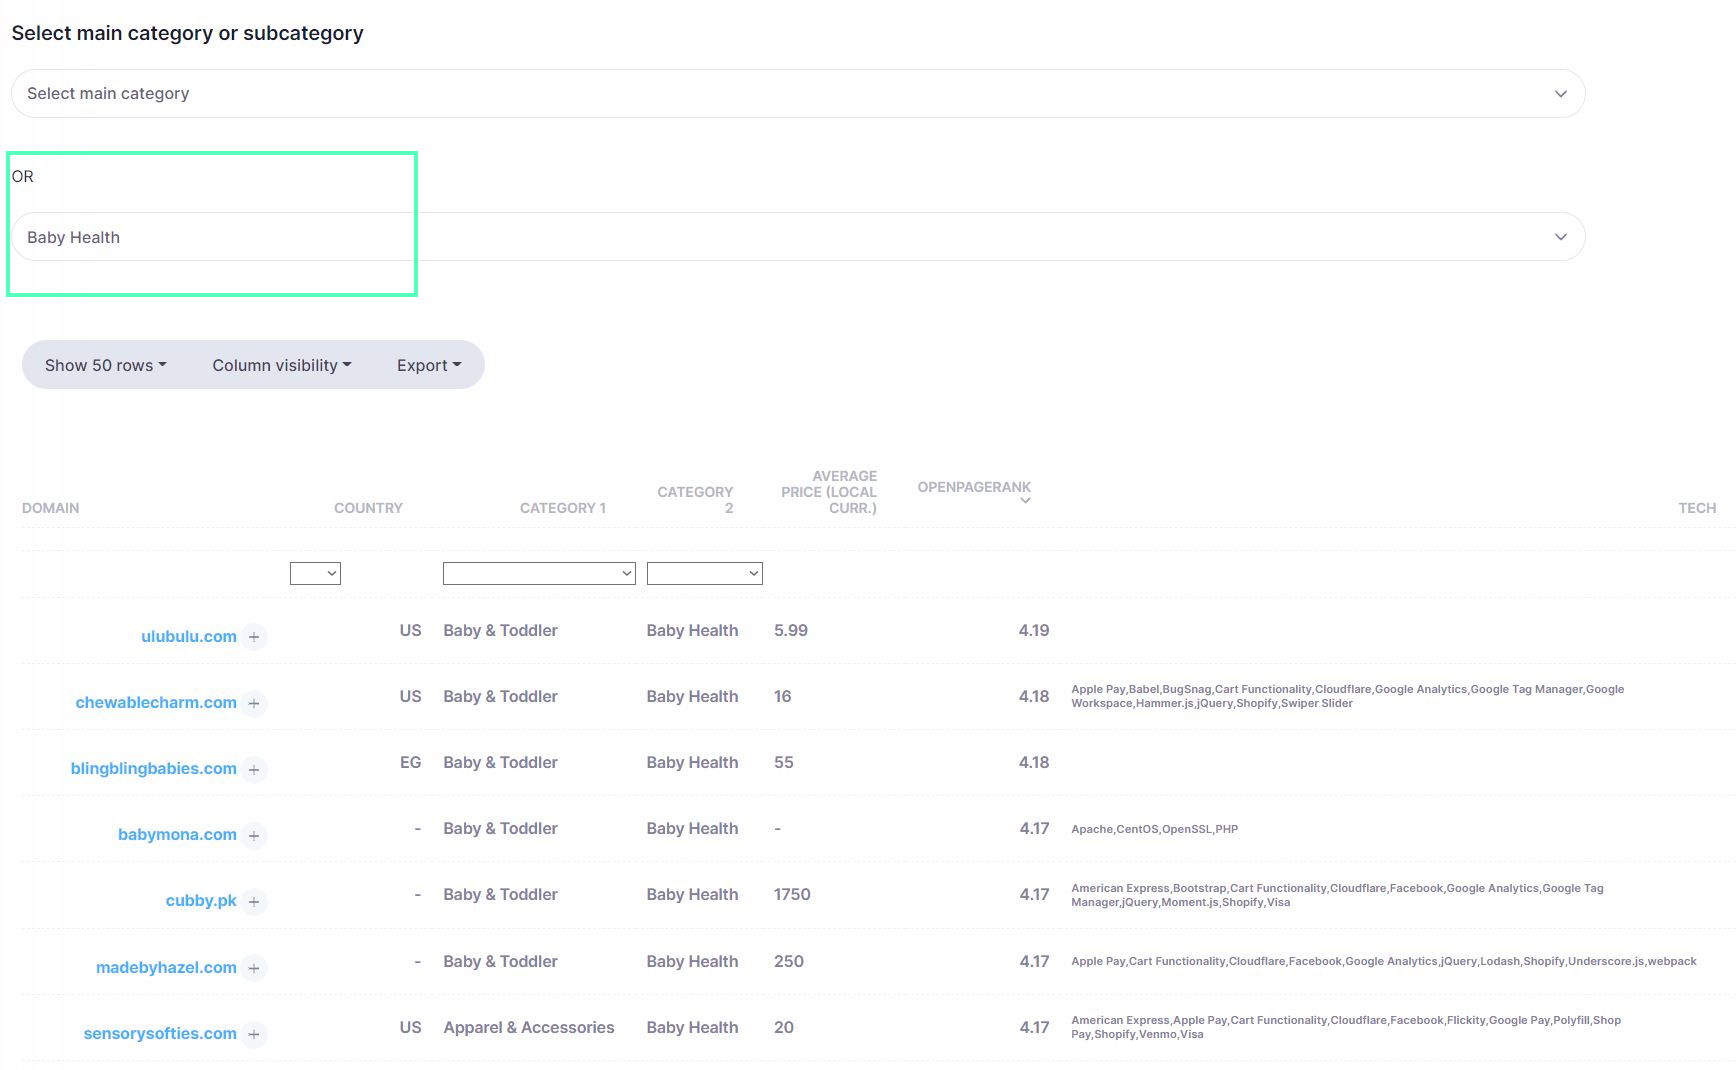
To find out all stores e.g. in subcategory "Baby Health" you select the appropriate subcategory from the
dropdown menu and obtain results in table, as shown below (for this subcategory more than 250 stores are found):
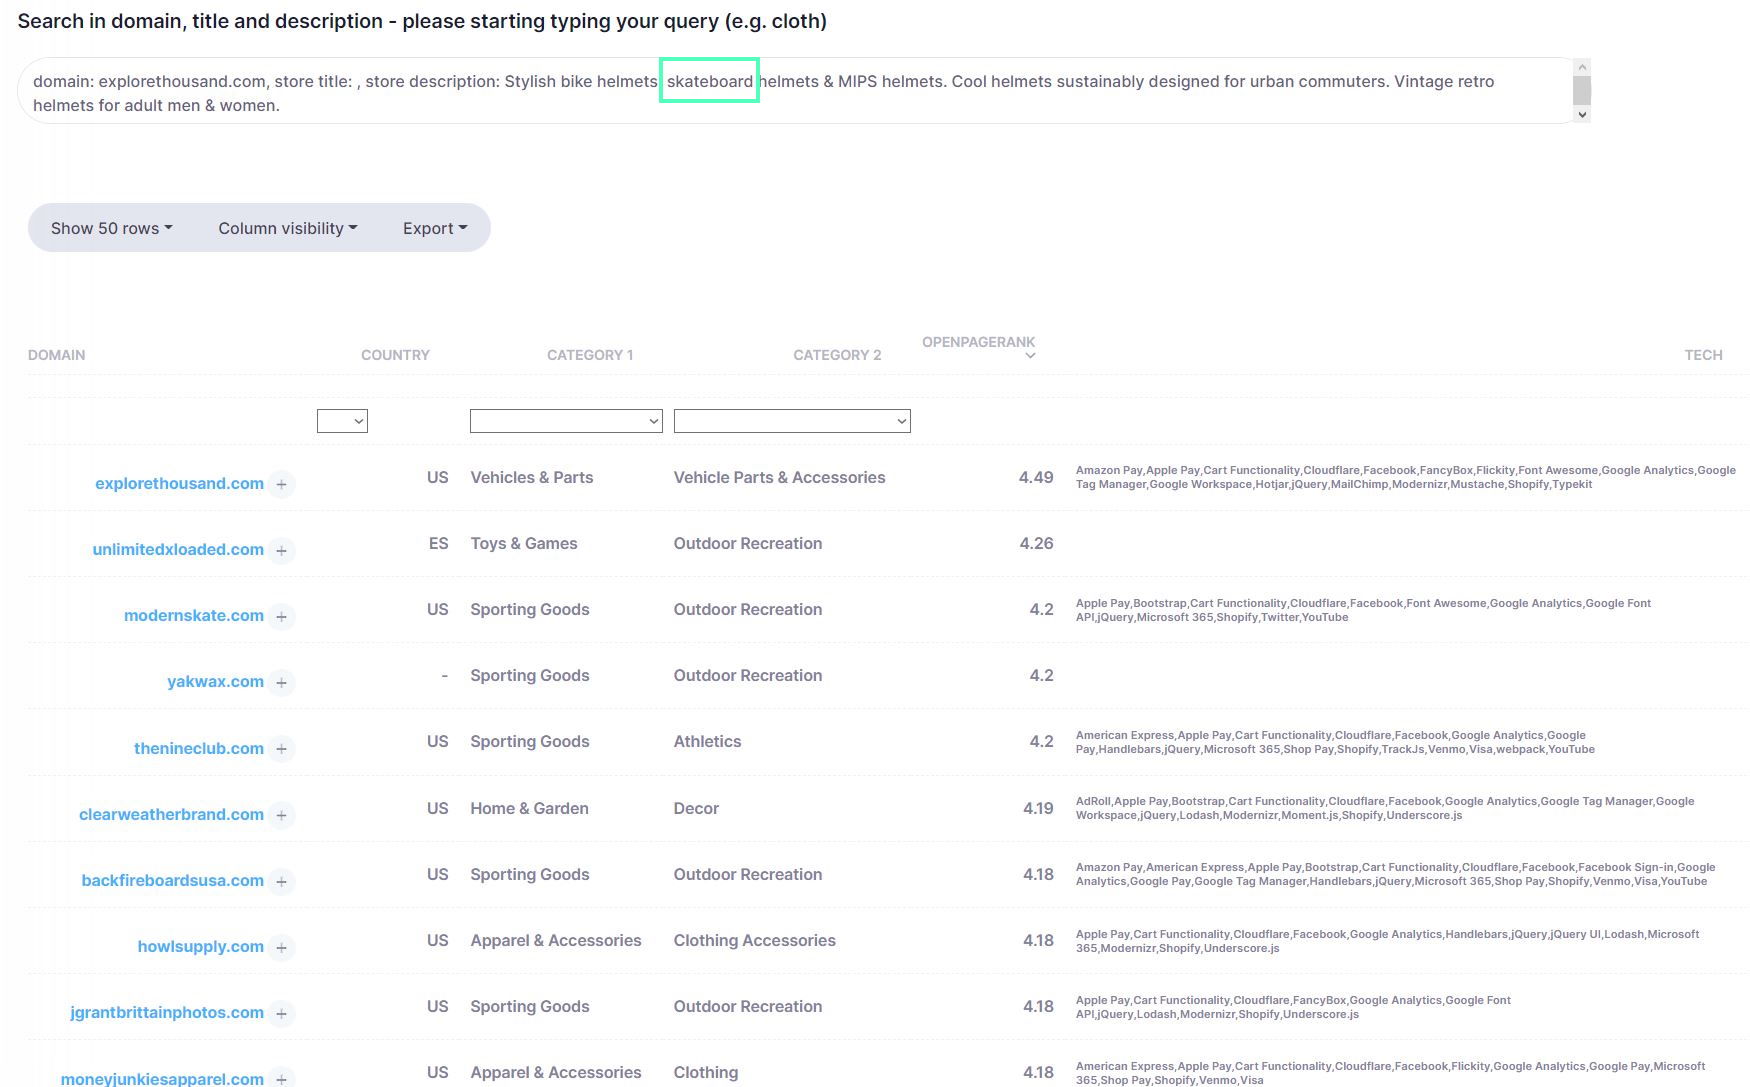
Alternatively, you can also search for stores by keyword.
For example, if you are interested in stores that sell
"skateboard" products, you can search for "skateboard" keyword and obtain 900 stores:
For each store in table, we provide more than 20 metrics and data points. Let us examine a few examples
of valuable analysis that can be done with this data.
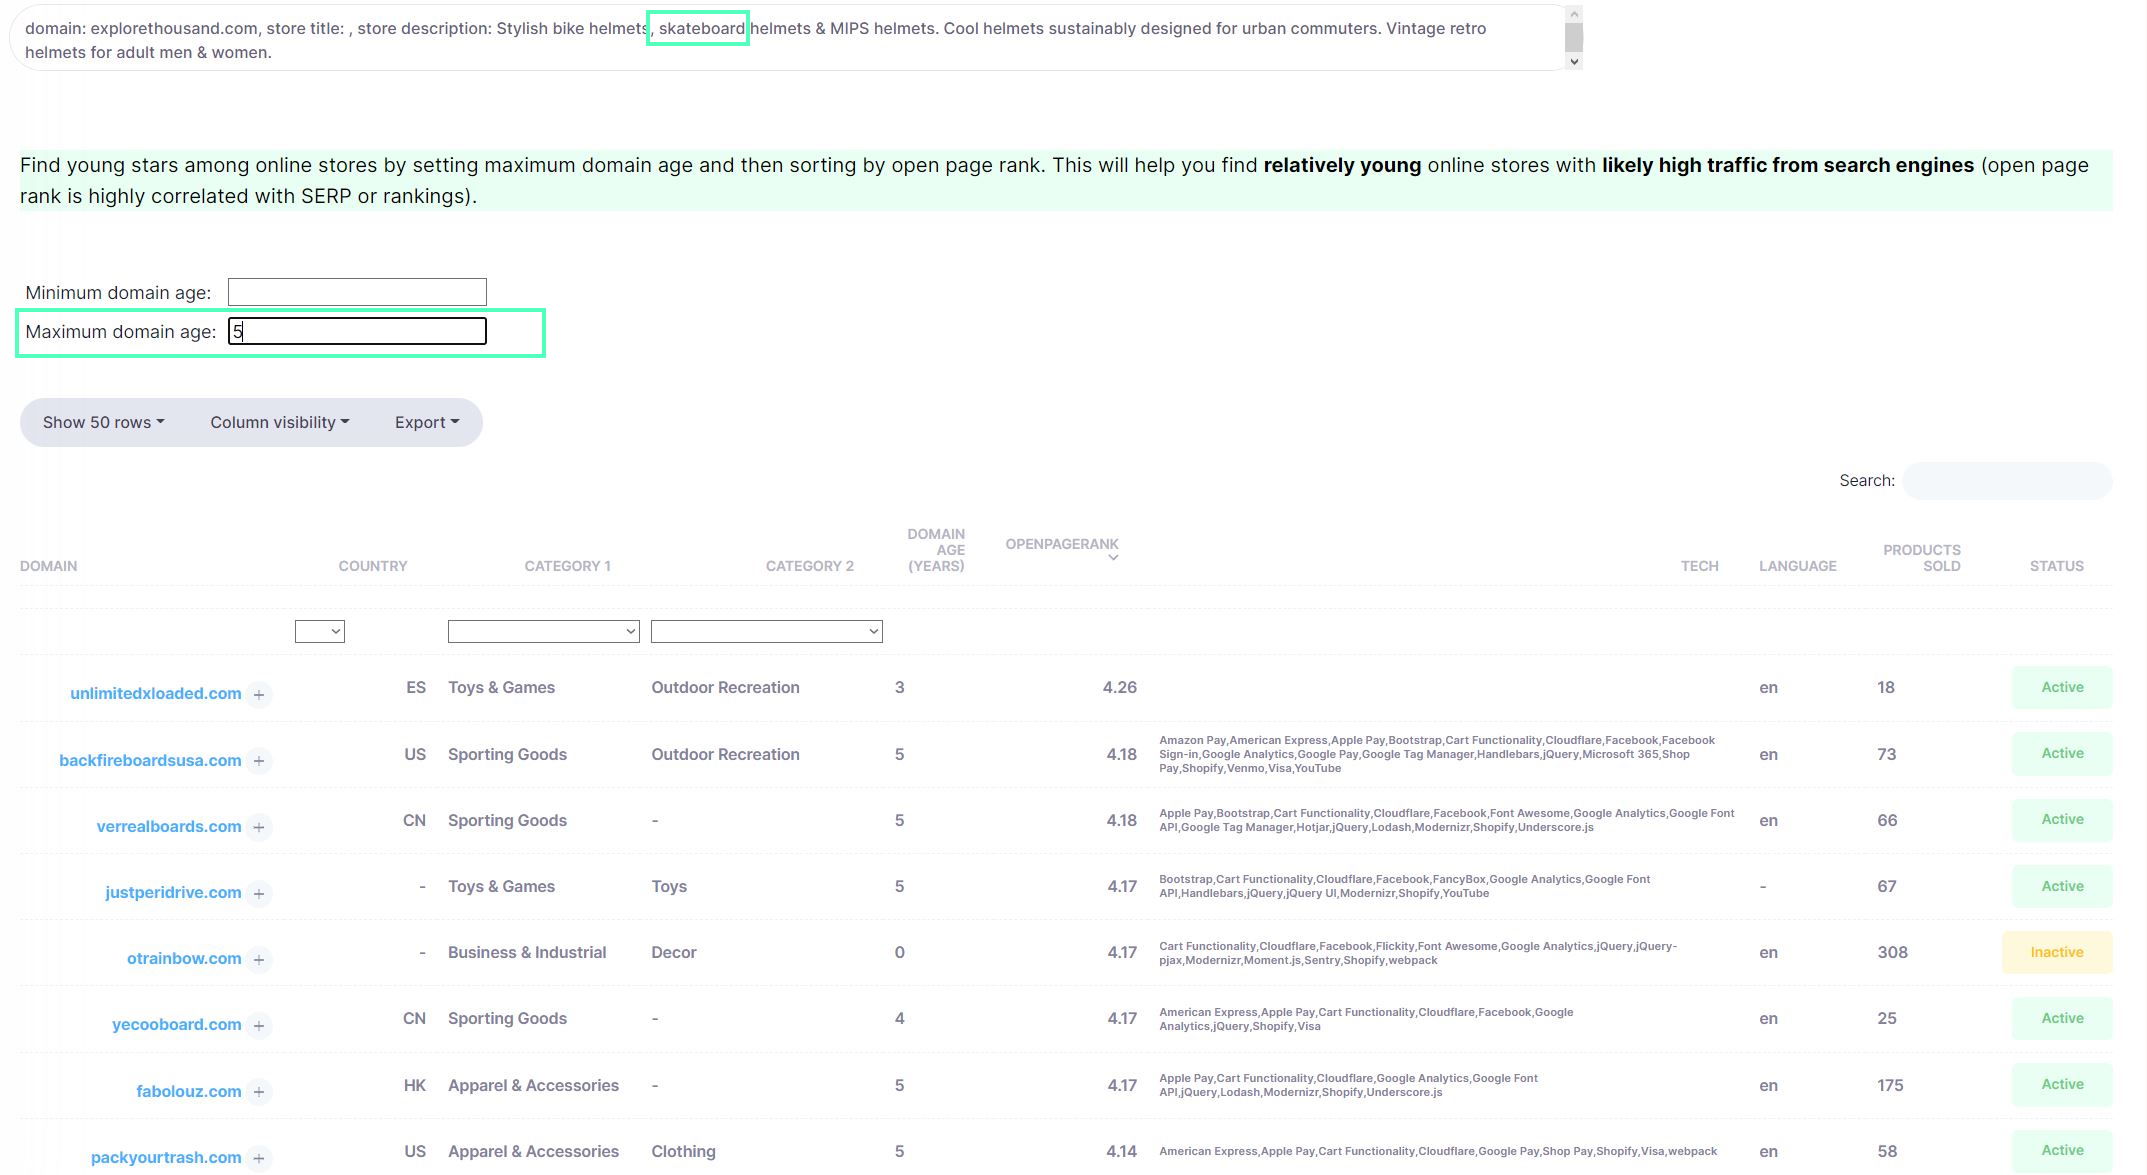
One way to find really interesting stores is to look for those that are young and have high open page
rank. This often means that their products are very popular/viral resulting in acquiring backlinks at a higher pace than others.
You get these domains in our dashboard by setting maximum domain age to e.g. 5 years and then ordering
by open page rank.
Here are results for stores that sell "skateboard" products:
The first result is domain unlimitedxloaded.com, by clicking on + sign, we get more information about this domain:
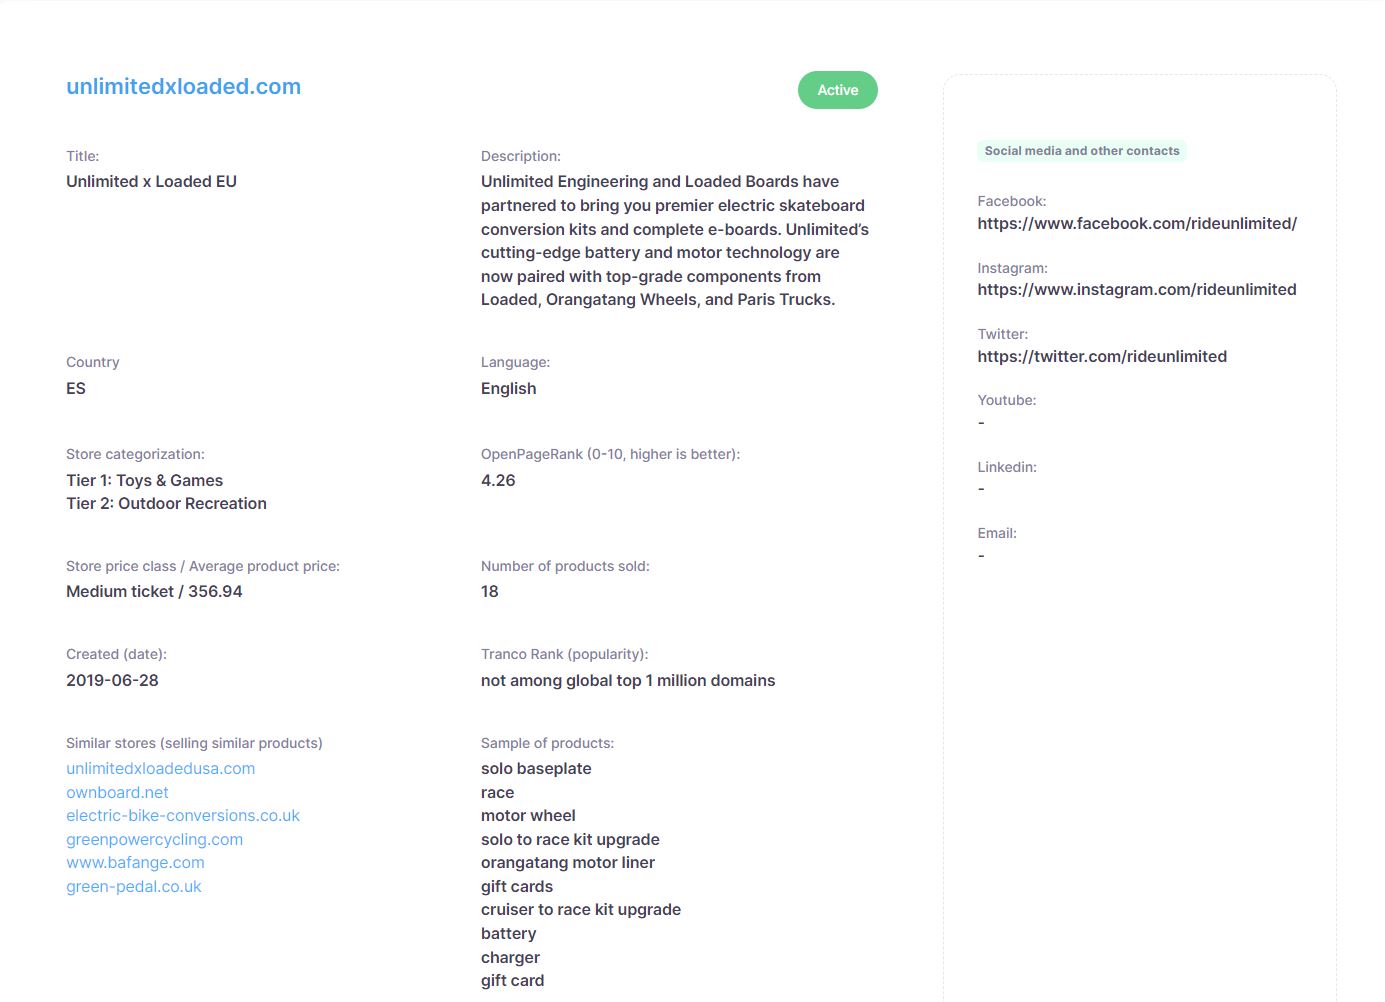
Checking out the top domains in this group shows that they are all offering some truly interesting and innovative electric skateboards, and making waves in their field.
This is something that we have found again and again, that some of the most interesting stores in any vertical are often the ones that have young domain age and have high open page rank.
Start using this powerful tool today and find your next big ideas.
See Plans
The analysis of stores however does not stop there, there are 20 other metrics to use to find interesting stores and new ideas.
Let us say that you are in vertical of Animals & Pet Supplies and you are looking for new high ticket eCom ideas. There are two ways you can do this on our platform.
One approach is to analyze 60,000+ groups of products (out of 32 million products that we analyzed, more on how to do that in the section below).
Or alternatively, you can use our stores analysis tool.
You can find all stores in specific vertical by e.g. selecting "Pets and Animal Supplies" from the dropdown menu, filtering country to US and then ordering by price (which will be in USD):
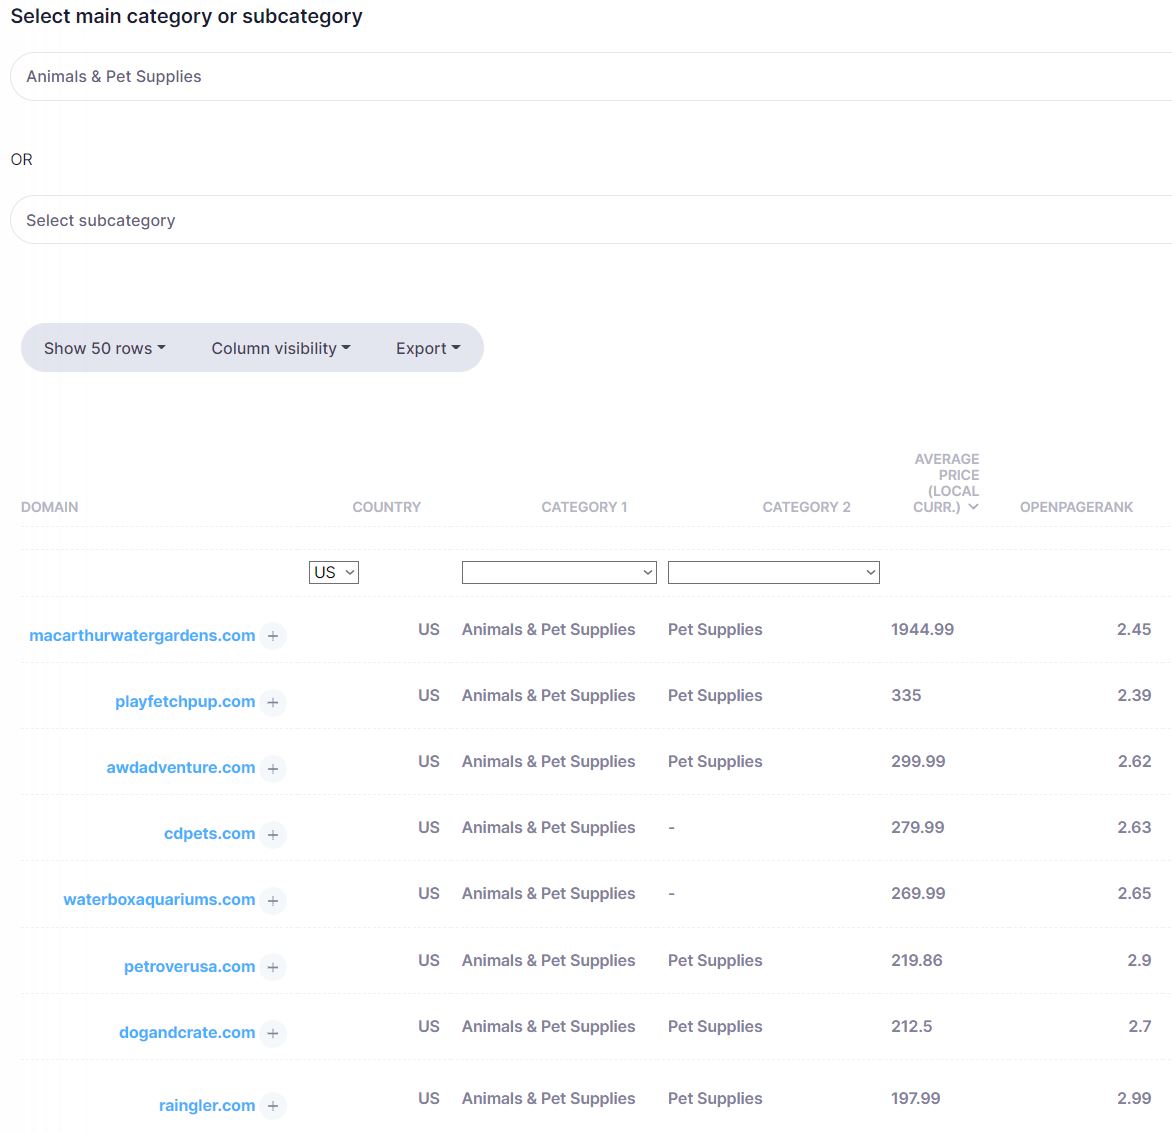
Checking out the top listed domains, one can see they are offering interesting products with high prices for products in this category, among others:
These are just 2 examples of how you can use our platform to find interesting stores in your vertical, for more check out our videos or subscribe to one of our plans and start using it today.
We have several ways of suggesting you which technologies are interesting for you to use in your business.
We have trained an advanced machine learning recommender which predicts with high accuracy which technologies are interesting for a website that uses specific list of technologies.
It was trained on usage of 4000+ different technologies by millions of websites (more than 100 million data points).
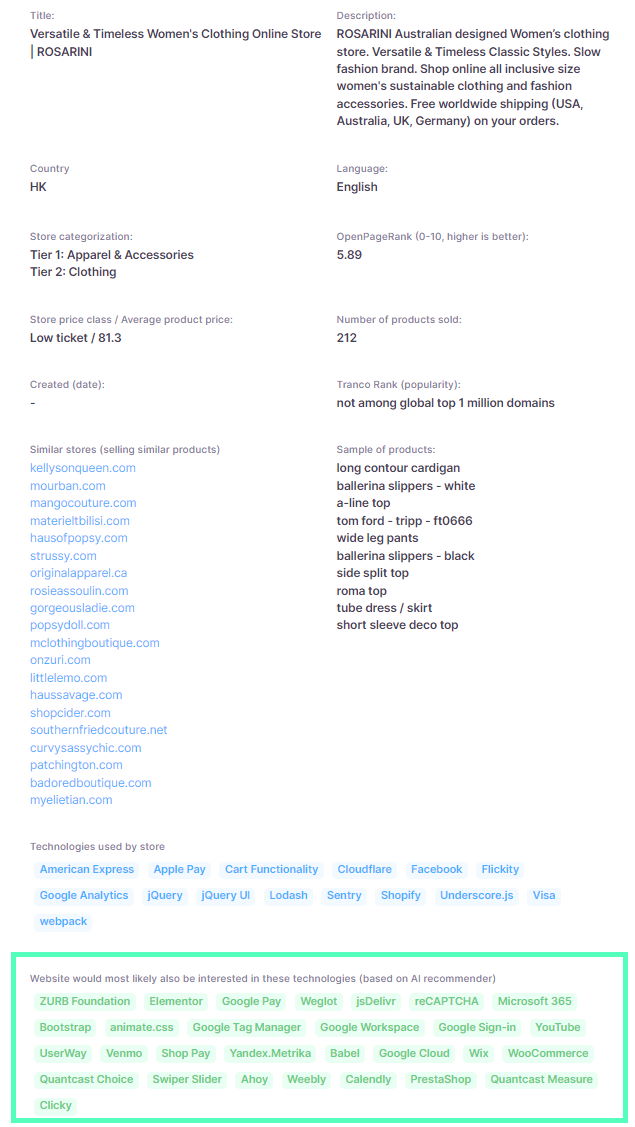
First approach to utilize our recommendation engine is to simply search for your online store in our database and if found, then check out the list of technologies that are recommended for it.
Here is an example for one of domains in our database (recommendations are marked with green box):
If your domain is not in our database, you can still use our engine to find out which technologies are interesting for you to use.
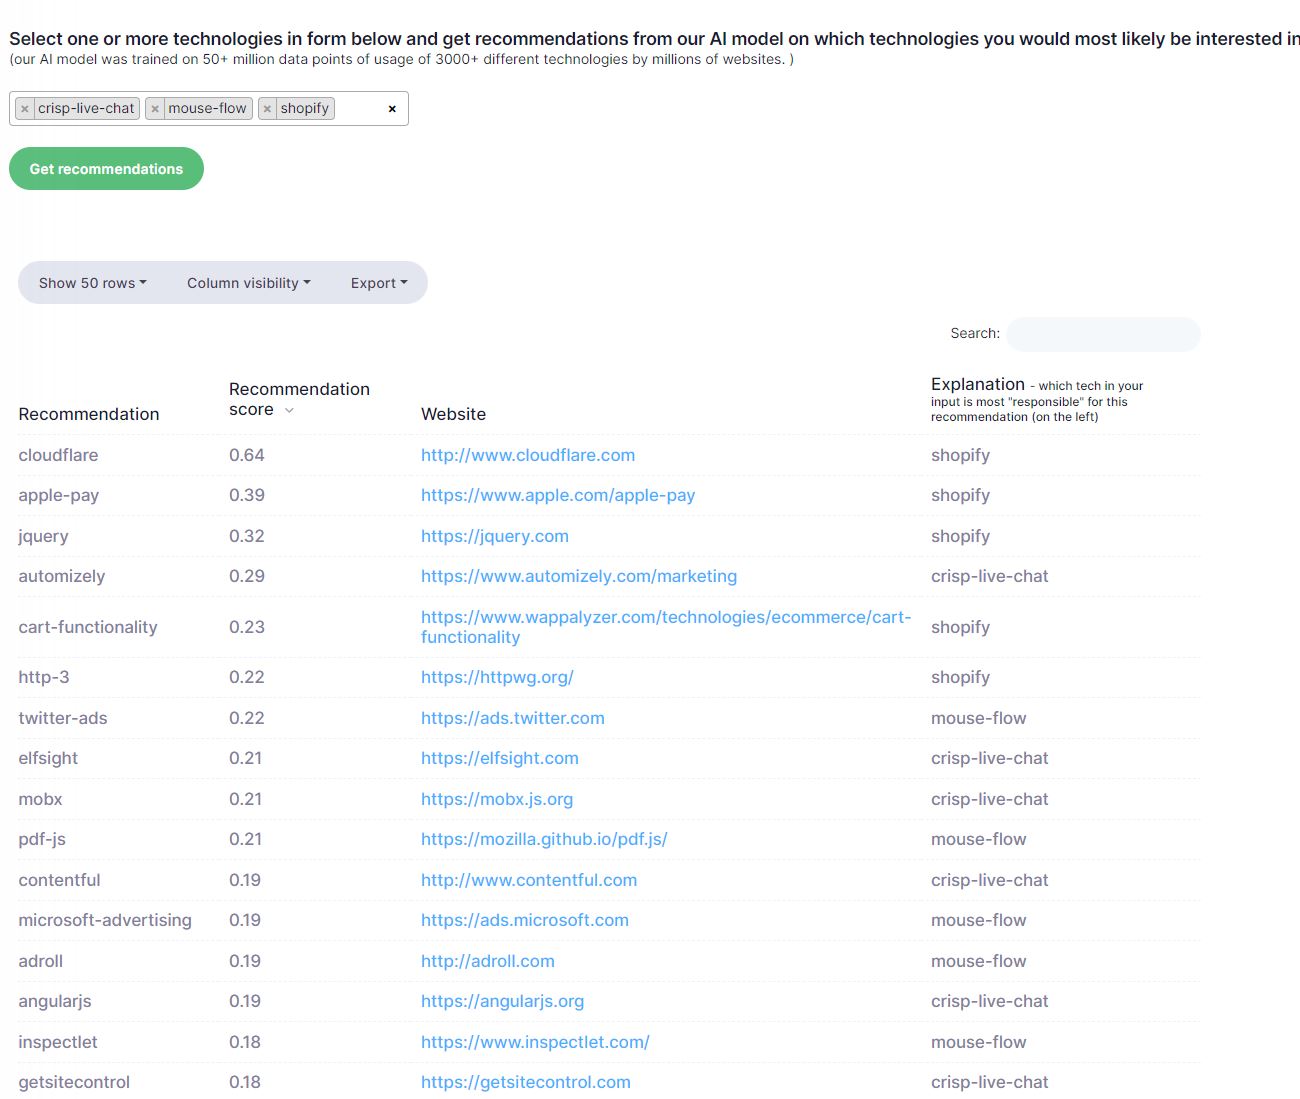
You can enter your currently used technologies in the search box and get the list of technologies that are recommended for you, below is an example for a website that uses mouse flow, crisp live chat and shopify.
We provide you with 1000 recommendations.
Note that for each recommendation we also provide "explainability", i.e. we tell you which technology that you currently use is most responsible for each specific recommendation.
Do you have a list of domains for which you would like to get recommendations from our engine? No problem, you can send us up to 500 domains and we will provide you with recommendations for all of them.
We will also soon launch an API so that you will be able to do this on your own.
These are just 2 examples of finding interesting technologies, others include determining your category (e.g. Baby Health) then finding top used technologies in that vertical.
An important task of store owner is looking for new products to sell.
Among possible ones, those with higher prices are especially attractive as they often come with higher margins.
Using the platform, our users can find those high ticket products in their verticals, in several ways.
On our platform we researched 32 million products, grouped into 60k product groups.
For each product group we determine a host of metrics, including:
Based on these metrics, we compute opportunity ratings for 60,000+ main product groups.
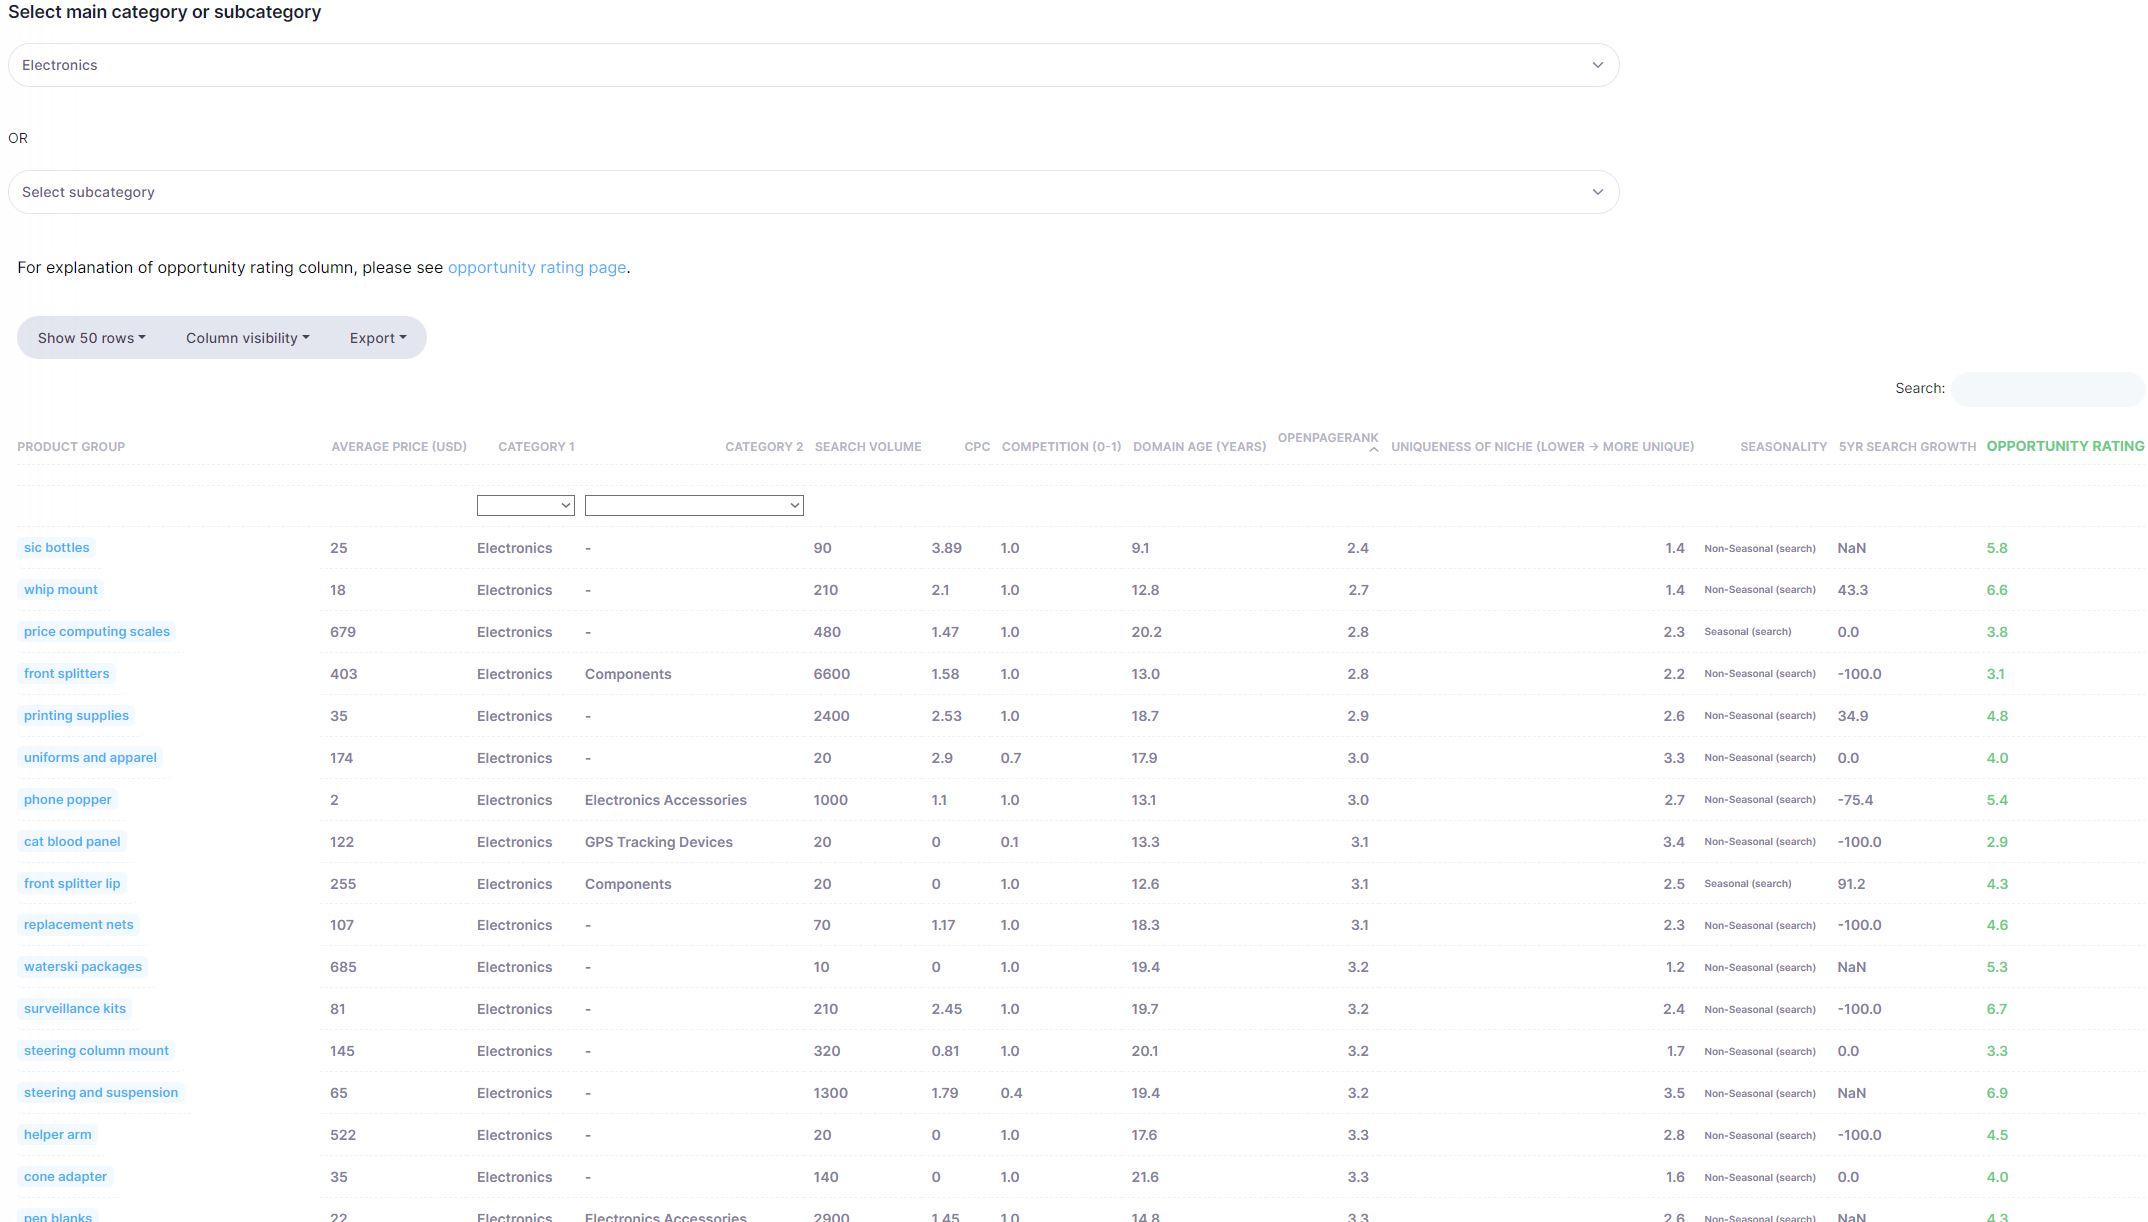
Let us select Tier 2 category of "Electronics":
We get a list of all product groups in this category, together with a host of metrics for them (see Appendix for explanation on each quantity).
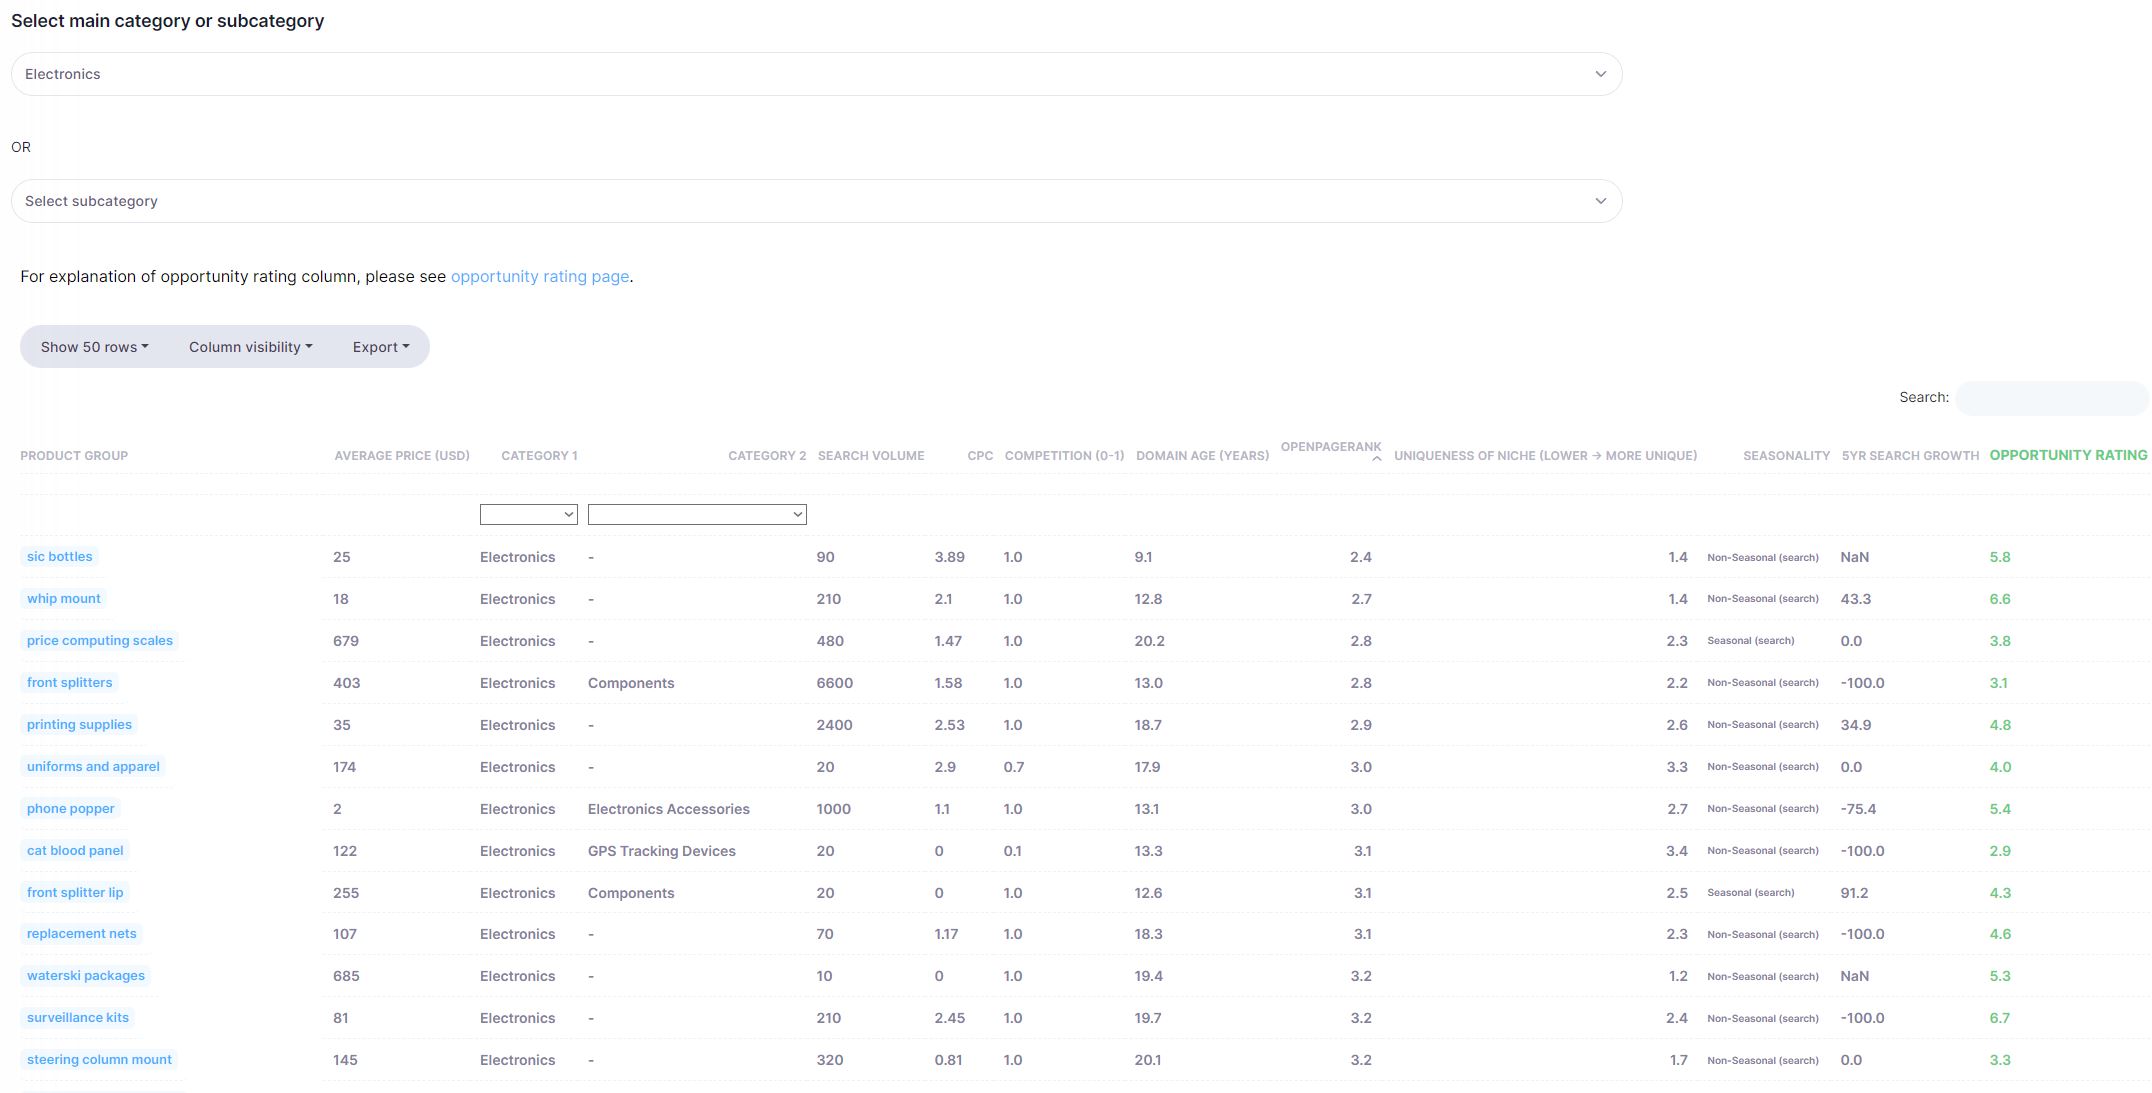
By ordering with respect to price, one can find a lot of interesting high ticket product group ideas in this vertical.
In addition to common ones like pinball machines, laptops, smart TVs, one also finds many interesting and unique ones, adding a few examples of those:
Another way to find high ticker product ideas is to sort with respect to opportunity rating.
How do we define opportunity rating?
Opportunity rating of a product group measures its opportunity, based on simultaneous consideration of the following factors:
Value of each factor listed above is converted to respective z-score and then the opportunity rating is computed as a weighted average of these z-scores. Weights are not equal, but are based on the relative importance of each factor. The relative weights are as follows:
We have collected usage of 4000+ different technologies by millions of websites (more than 100 million data points).
And used this data to train an advanced machine learning recommender which predicts which new technologies are interesting for a website that already uses specific list of technologies.
We use same underlying type of AI model that is used by large retailers and tech companies to recommend products to their customers.
Except instead of recommending new interesting retail products, based on your history of purchases, we are recommending new technologies to companies/websites, based on their current usage of technologies.
We believe that this is a much better way to find excellent new leads than using more traditional method of looking for websites that use competing technologies (although we do also provide this functionality on our platform).
Why? In case of competing technologies, one needs to convince the website owner to switch to your technology, which is not always easy.
However, with our approach, we suggest websites that may be highly likely interested in using a new technology with no existing competitor, so you can simply offer them your product as an addition to their existing stack.
Le us look at an example of how this works by determining those online stores (from more than 1 million analyzed) that are most likely interested in using Crisp Live Chat.
We enter the name of the technology in the search box and get the list of websites, see image below.
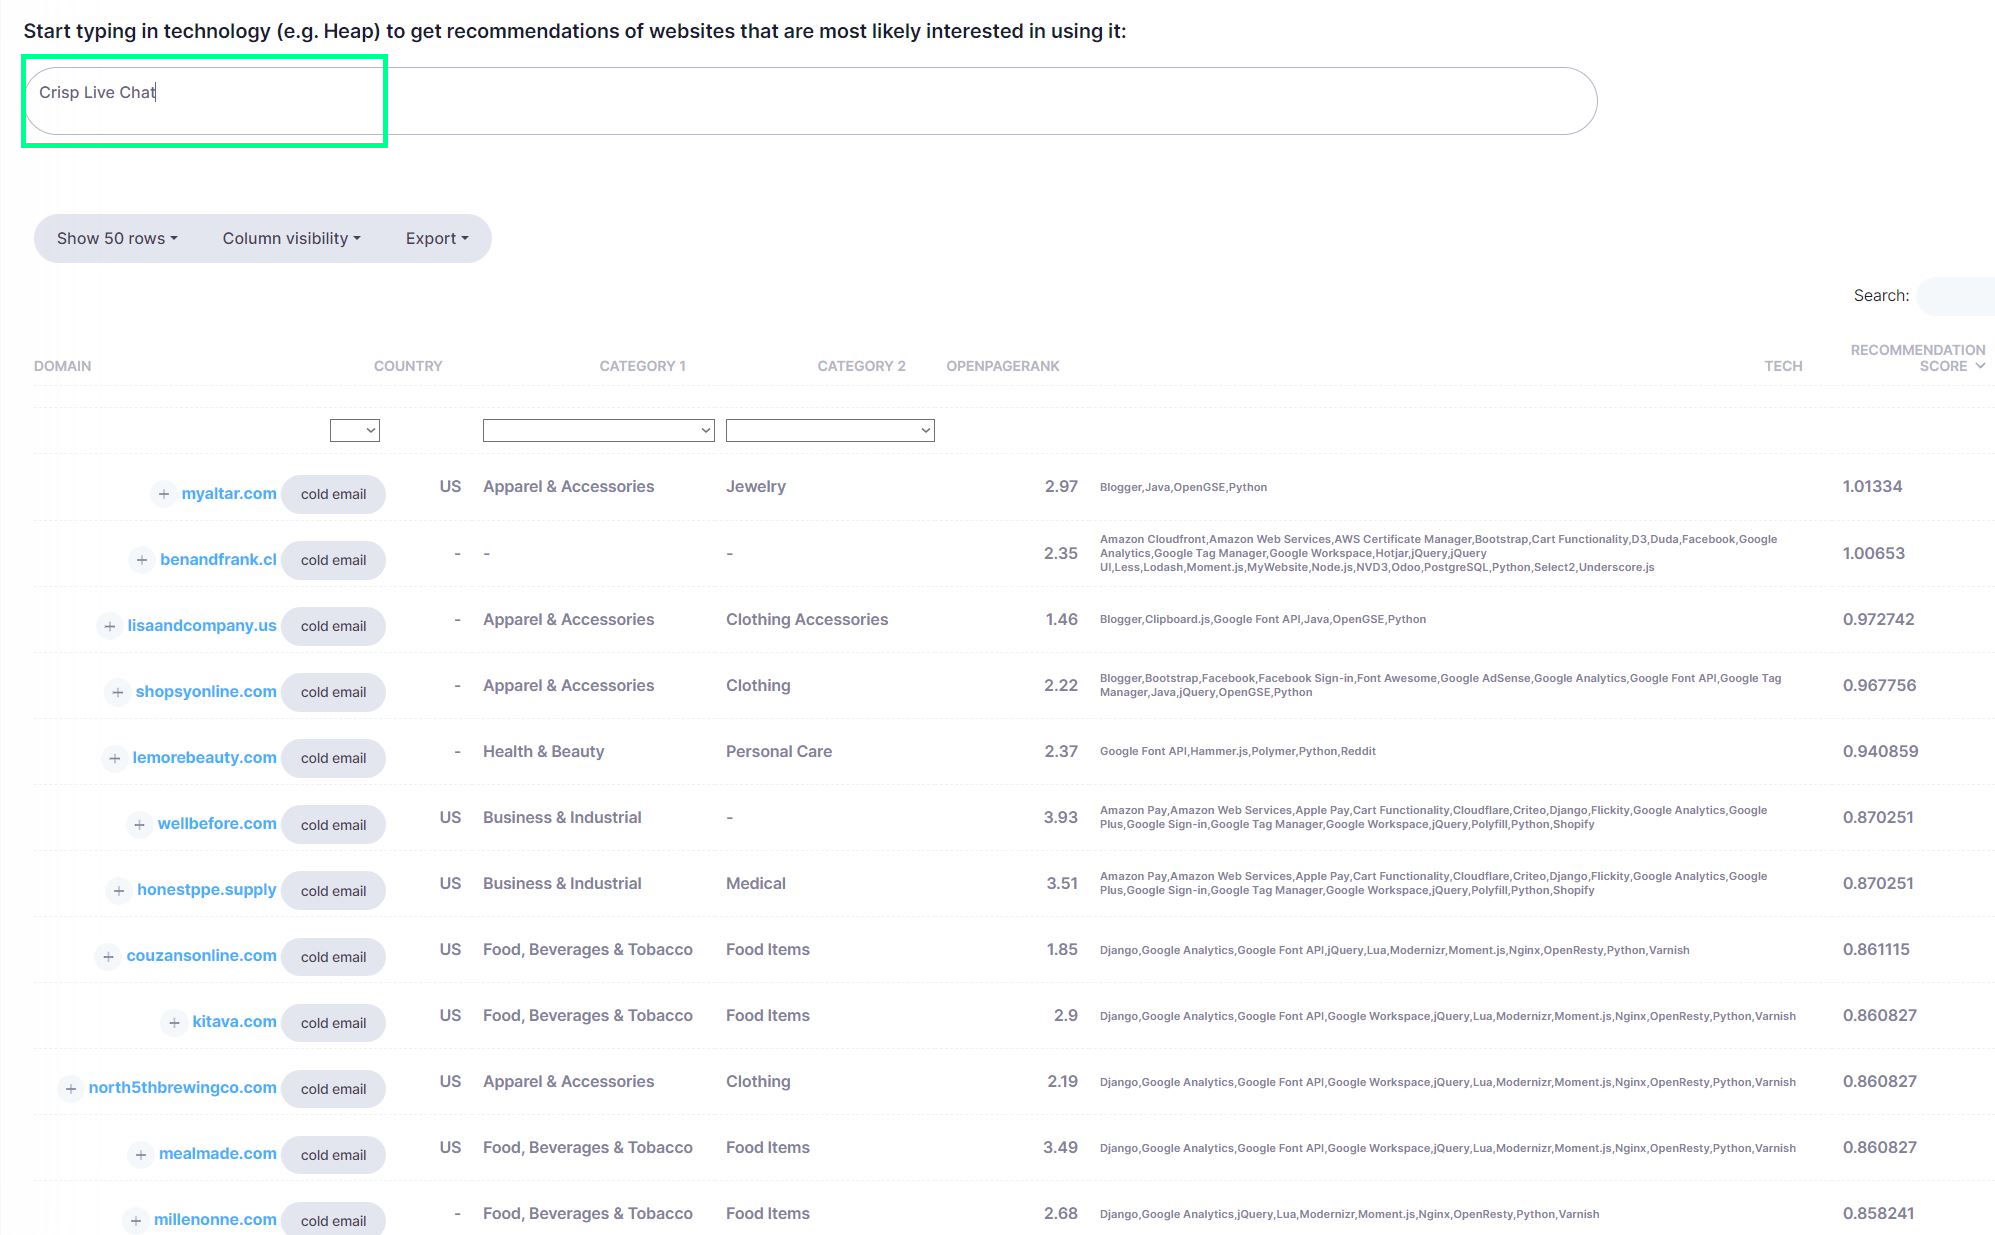
The list contains thousands of websites (the number depends on your plan) and can be exported to CSV, PDF and other formats.
But there is even more.
In addition to 1+ million online stores, we also generated tech recommendations for around 5 million most popular (non-eCommerce) domains worldwide, so
you can also get a list of websites that are most likely interested in given technology, from this much larger and more general 5 million domains data set.
The approach described above uses AI based recommender.
But we developed another, additional way to find websites that are likely interested in your technology, by focusing on categorization of websites.
Let us explain.
Having determined technology usage for more than 5 million domains, we then classified them according to IAB taxonomy (two Tiers, with 440 categories).
This means we can take any technology and determine its relative usage per category and thus in which vertical/category it is used above average (i.e. more that is its share when all domains are considered).
Consider e.g. Shopify technology, this is its relative usage across Tier 1 IAB categories:
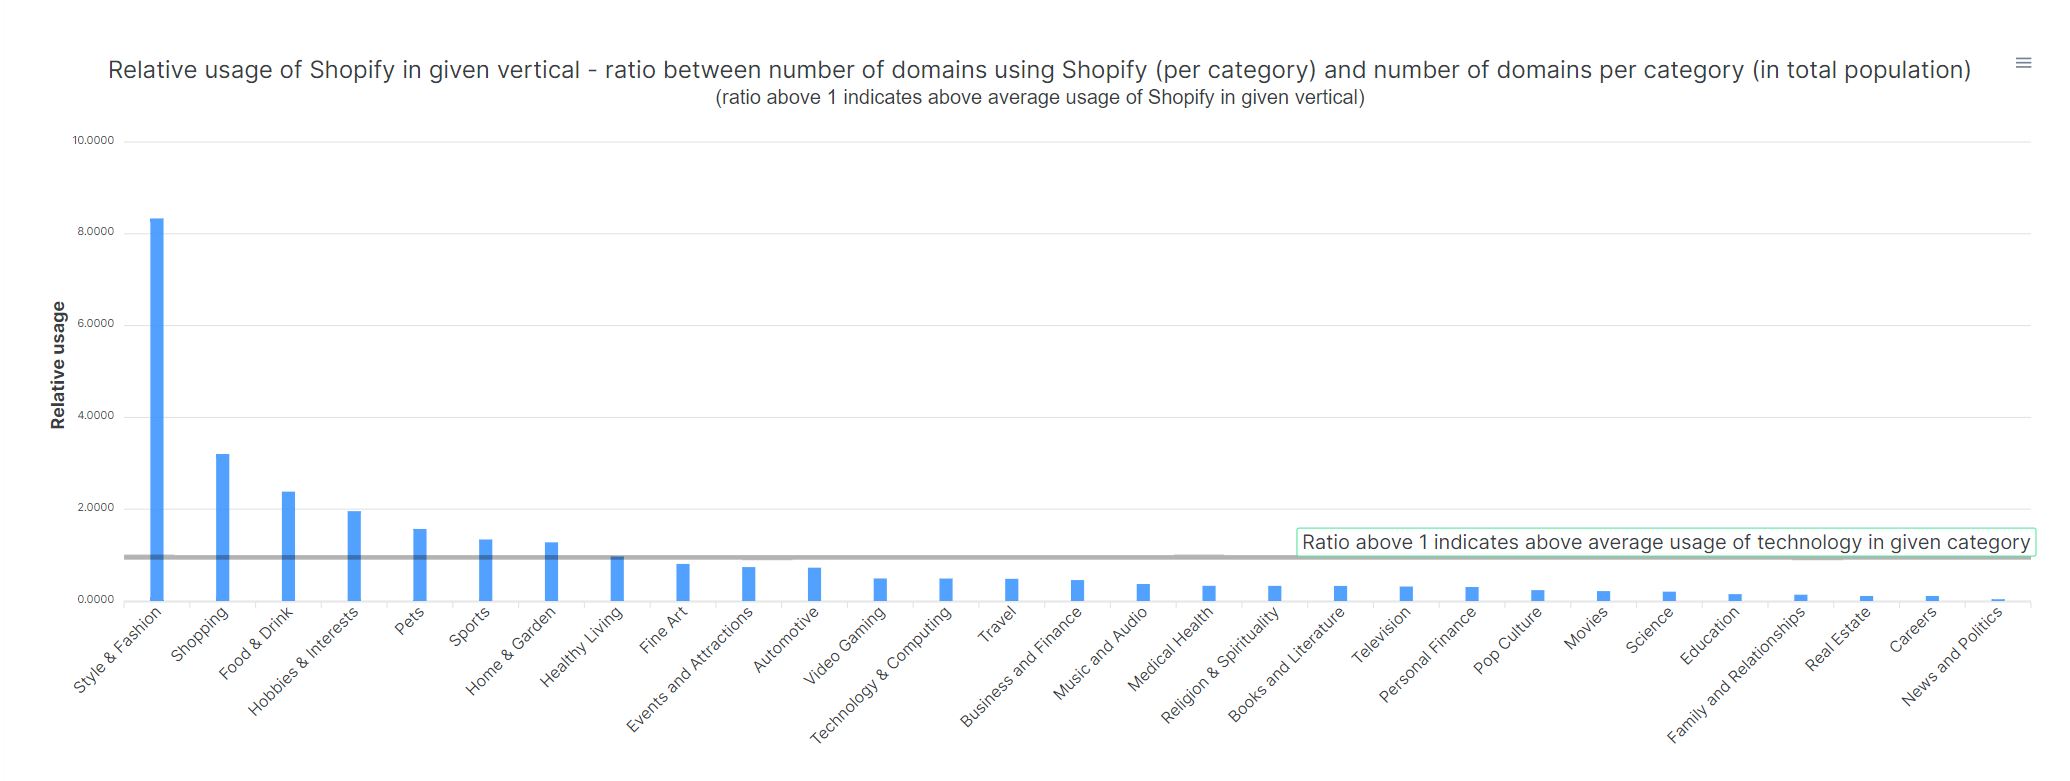
You can see that Shopify is used in "Style & Fashion" category 8.1-times more that this category's share in all domains.
Above average verticals are all those above the line with ratio = 1.0, thus also Shopping, Food & Drink, Hobbies & Interests, Pets, Sports, Home & Garden.
The results are in line with expectations, as Shopify is a popular eCommerce platform and one would expect Shopify to have larger presence in the "eCommerce" themed IAB categories.
Here is the chart that shows technology usage across all IAB Tier 1 categories, together with share for each category in all domains:
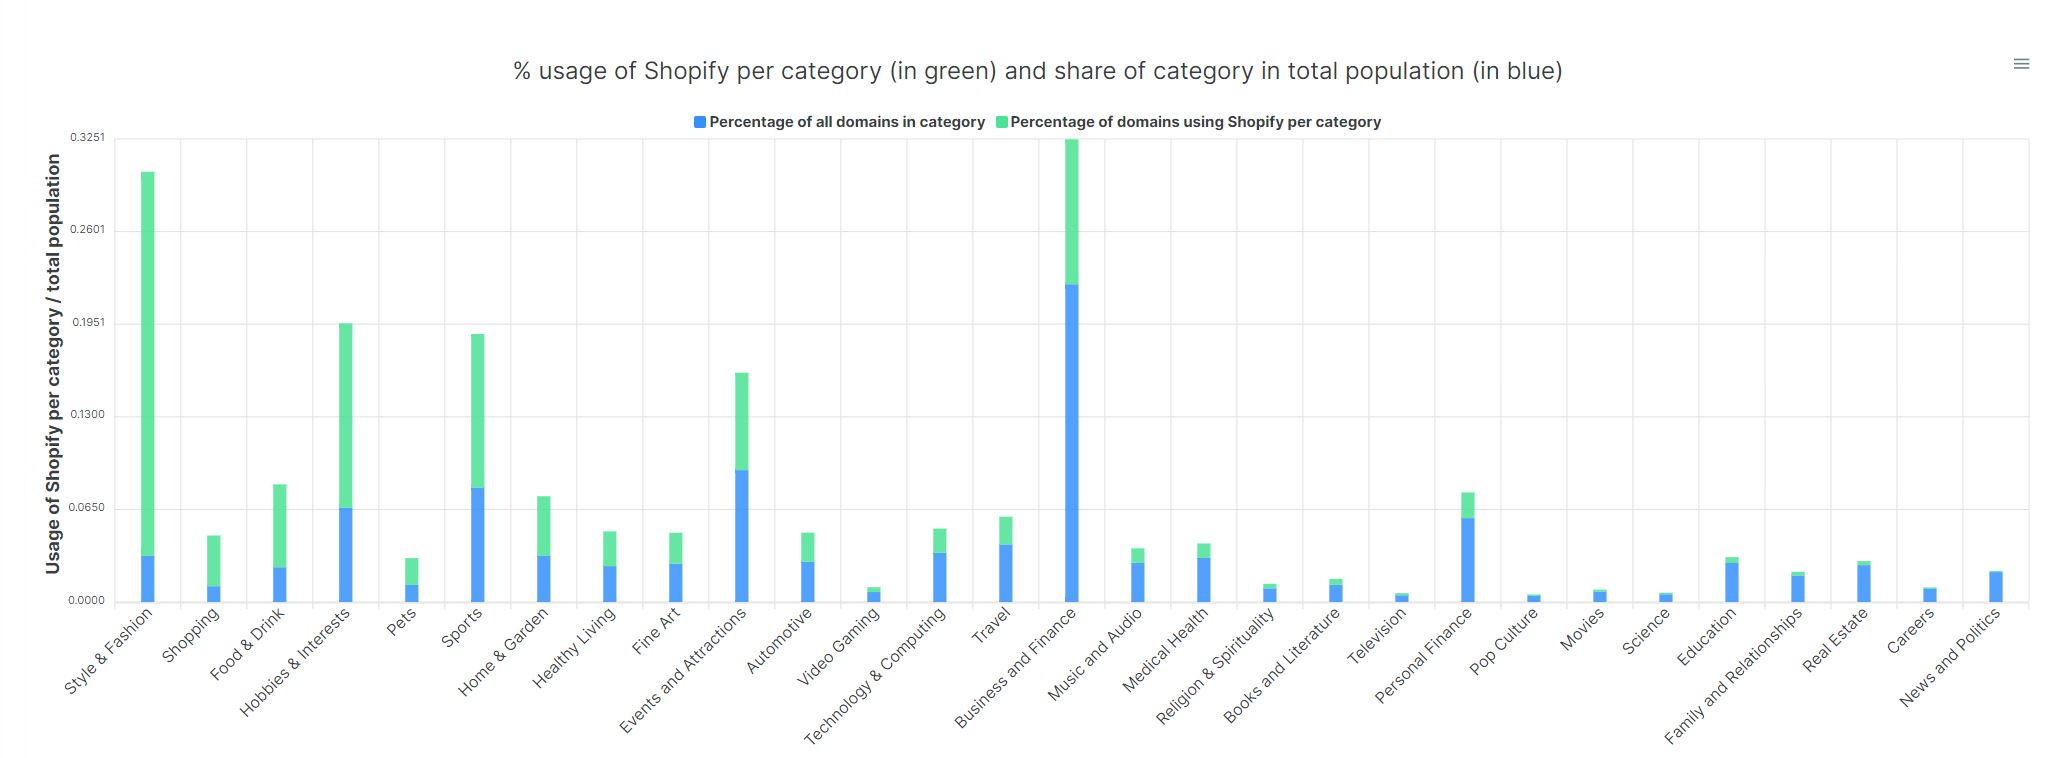
You can see what are the baseline shares for each category in total population of domains. Style & Fashion is e.g. not in top 5 in general population, but has by far the highest share when only those domains are considered which use Shopify, as already noted above.
We can go into even more in detail, by analyzing relative usage across Tier 2 categories, of which there are 440 distinct ones (we are only showing top 50 for brevity):
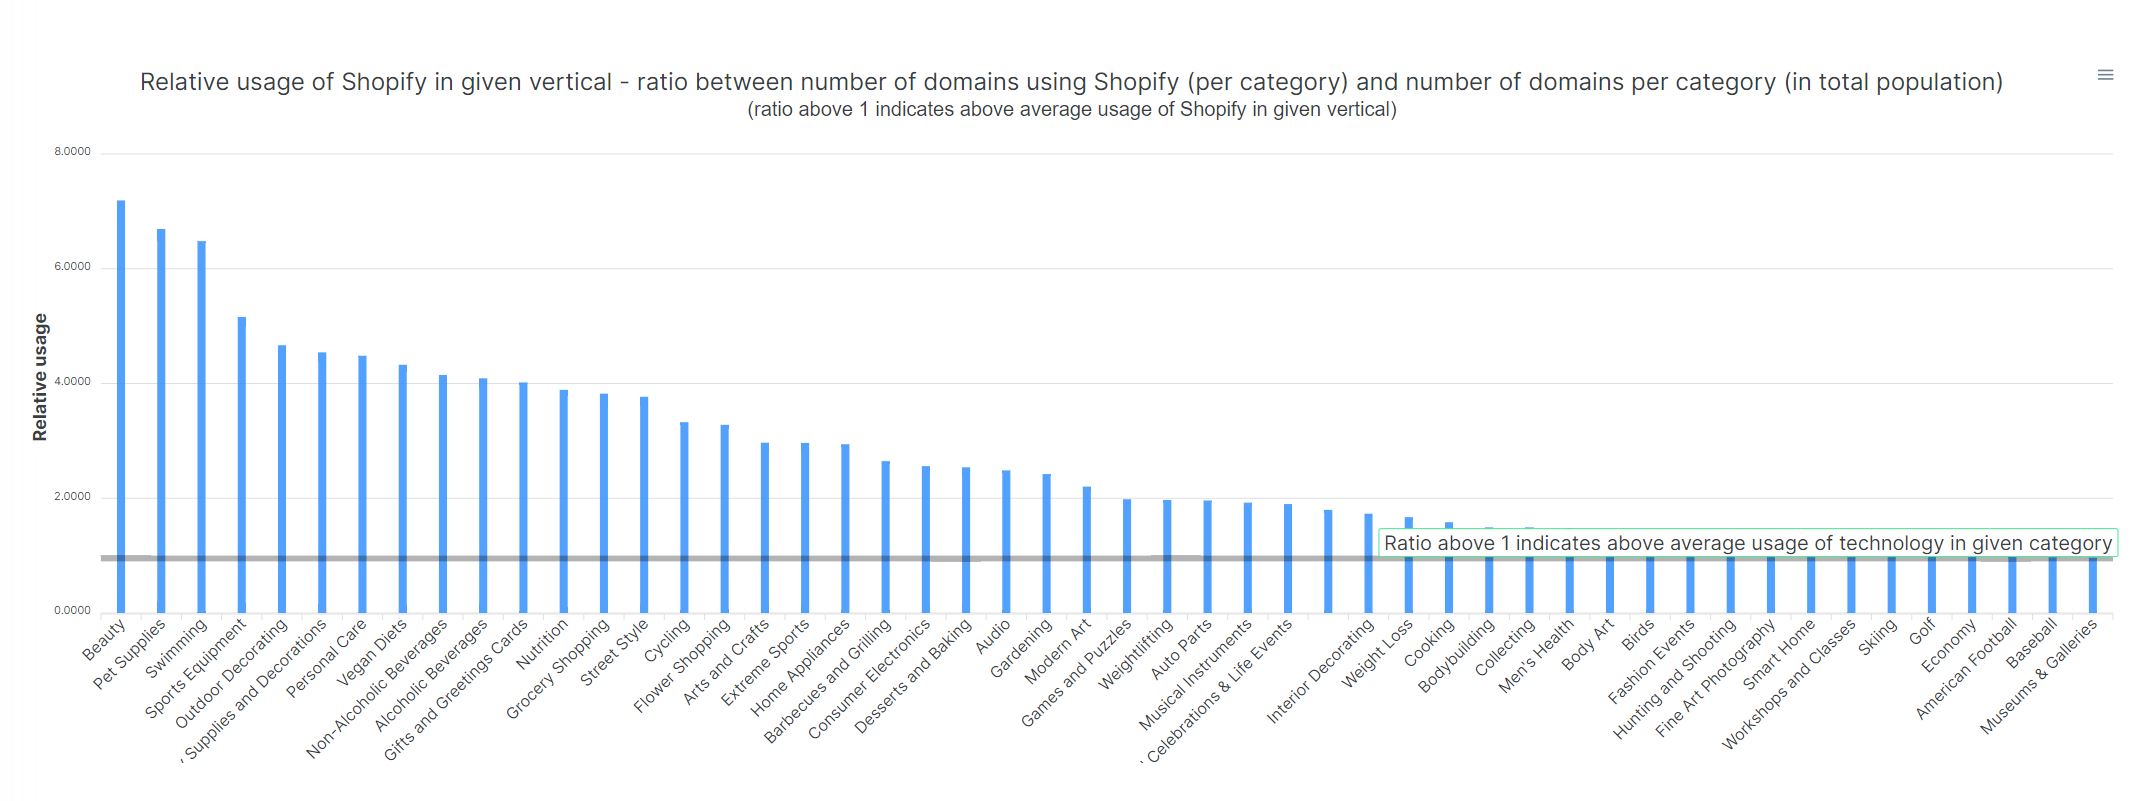 Again, above average verticals are quite expected, a selection of top 20 :
They are eCommerce themed categories as one would expect for Shopify.
How can the owner of this technology or lead generation user use this category based approach?
By targeting their lead generation efforts to those verticals/categories where their technology is used above average.
And we can immediately help you with this, as we have classified over 5 million most popular domains according to IAB taxonomy.
So for any technology on our list of 4000+ technologies, we can provide you with the list of domains that are 1) in above average verticals for given technology, but 2) are not yet using your technology.
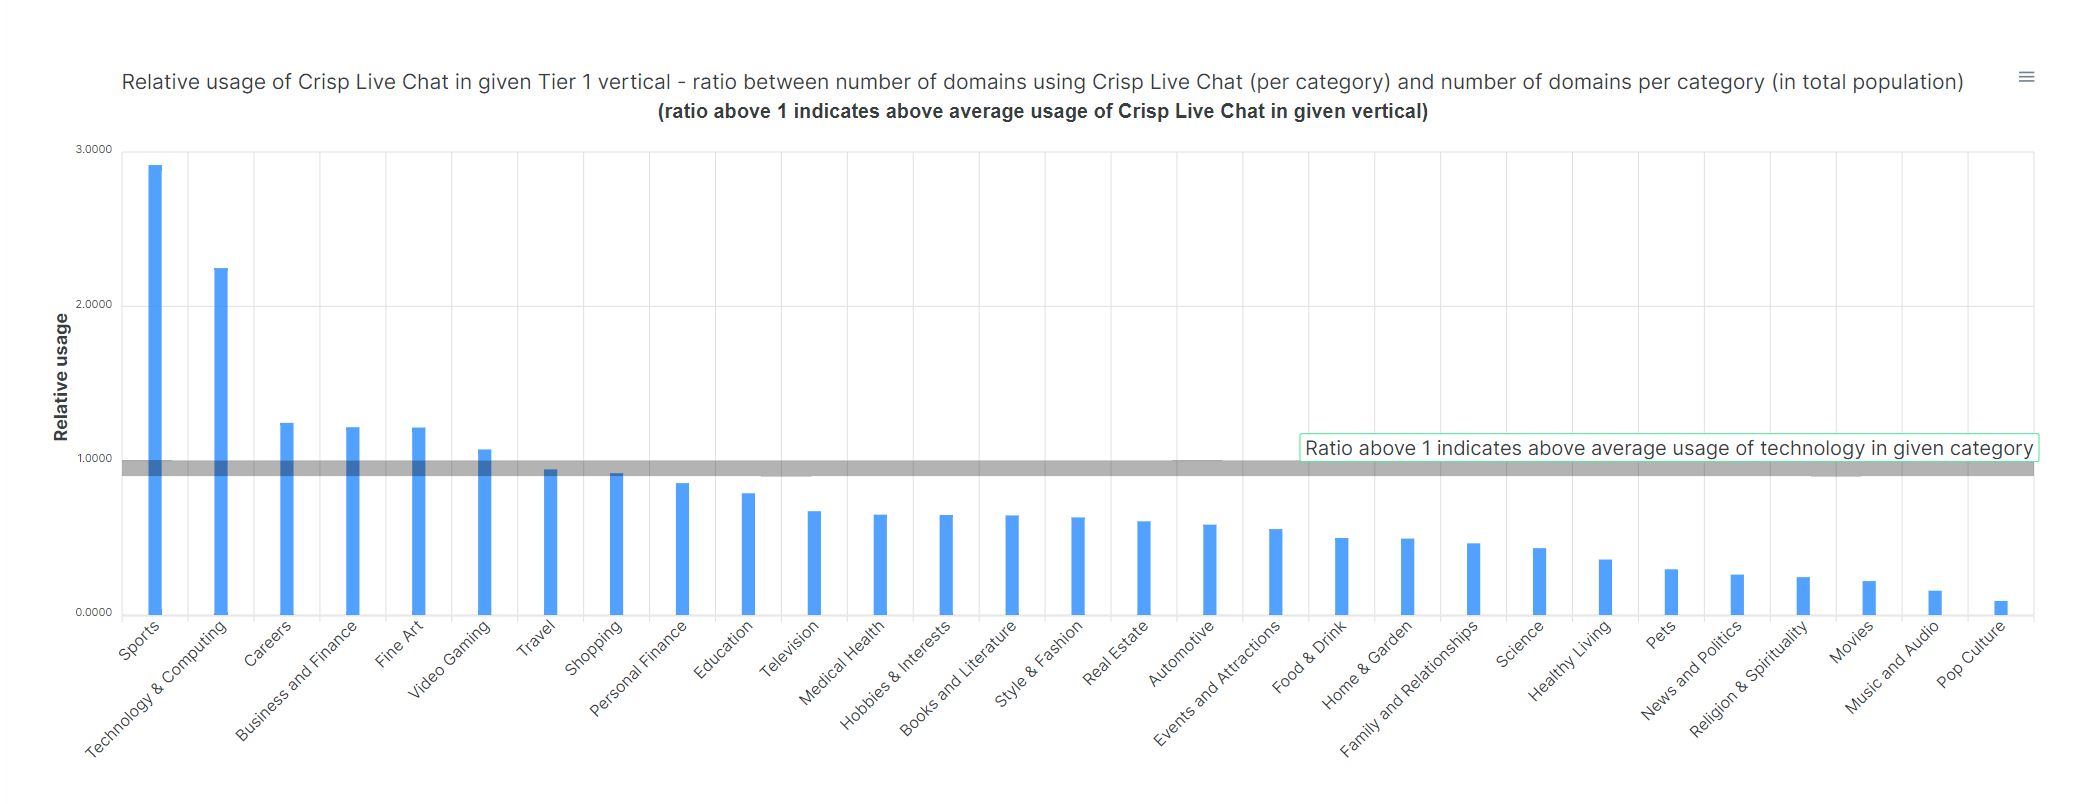
Let us look at a few more technologies, which are more general, and see how they are used across Tier 1 IAB categories.
First, Crisp Live chat:
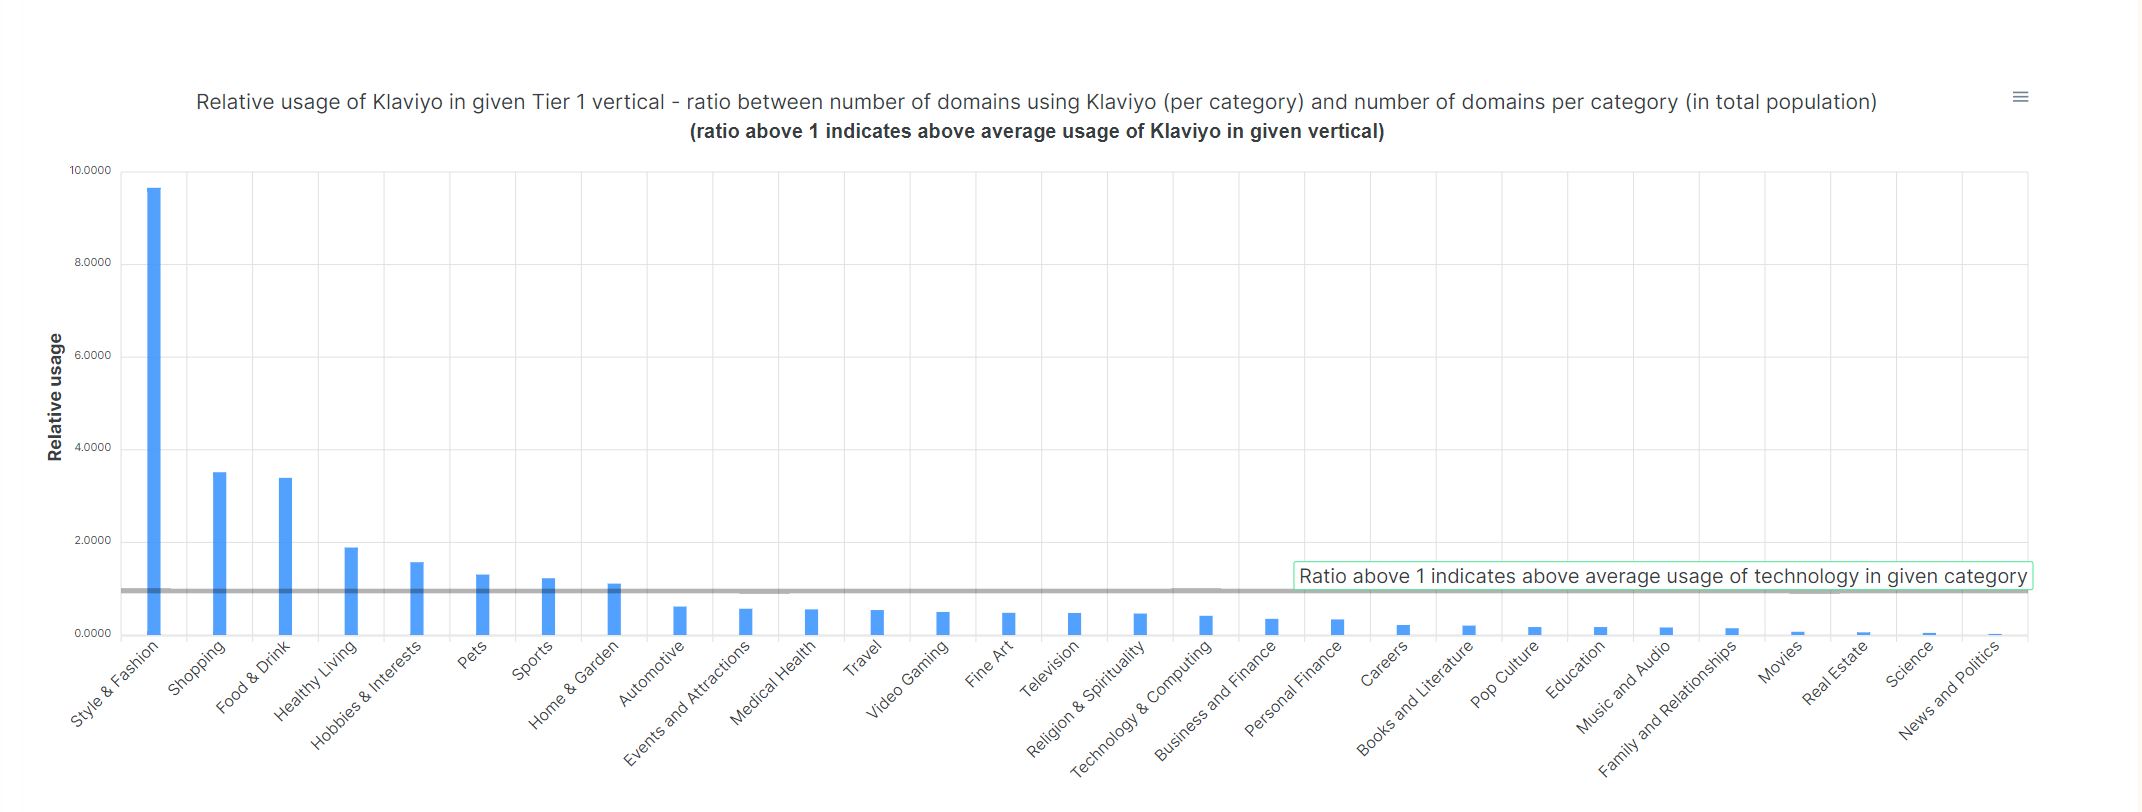
Klaviyo:
Wordpress:
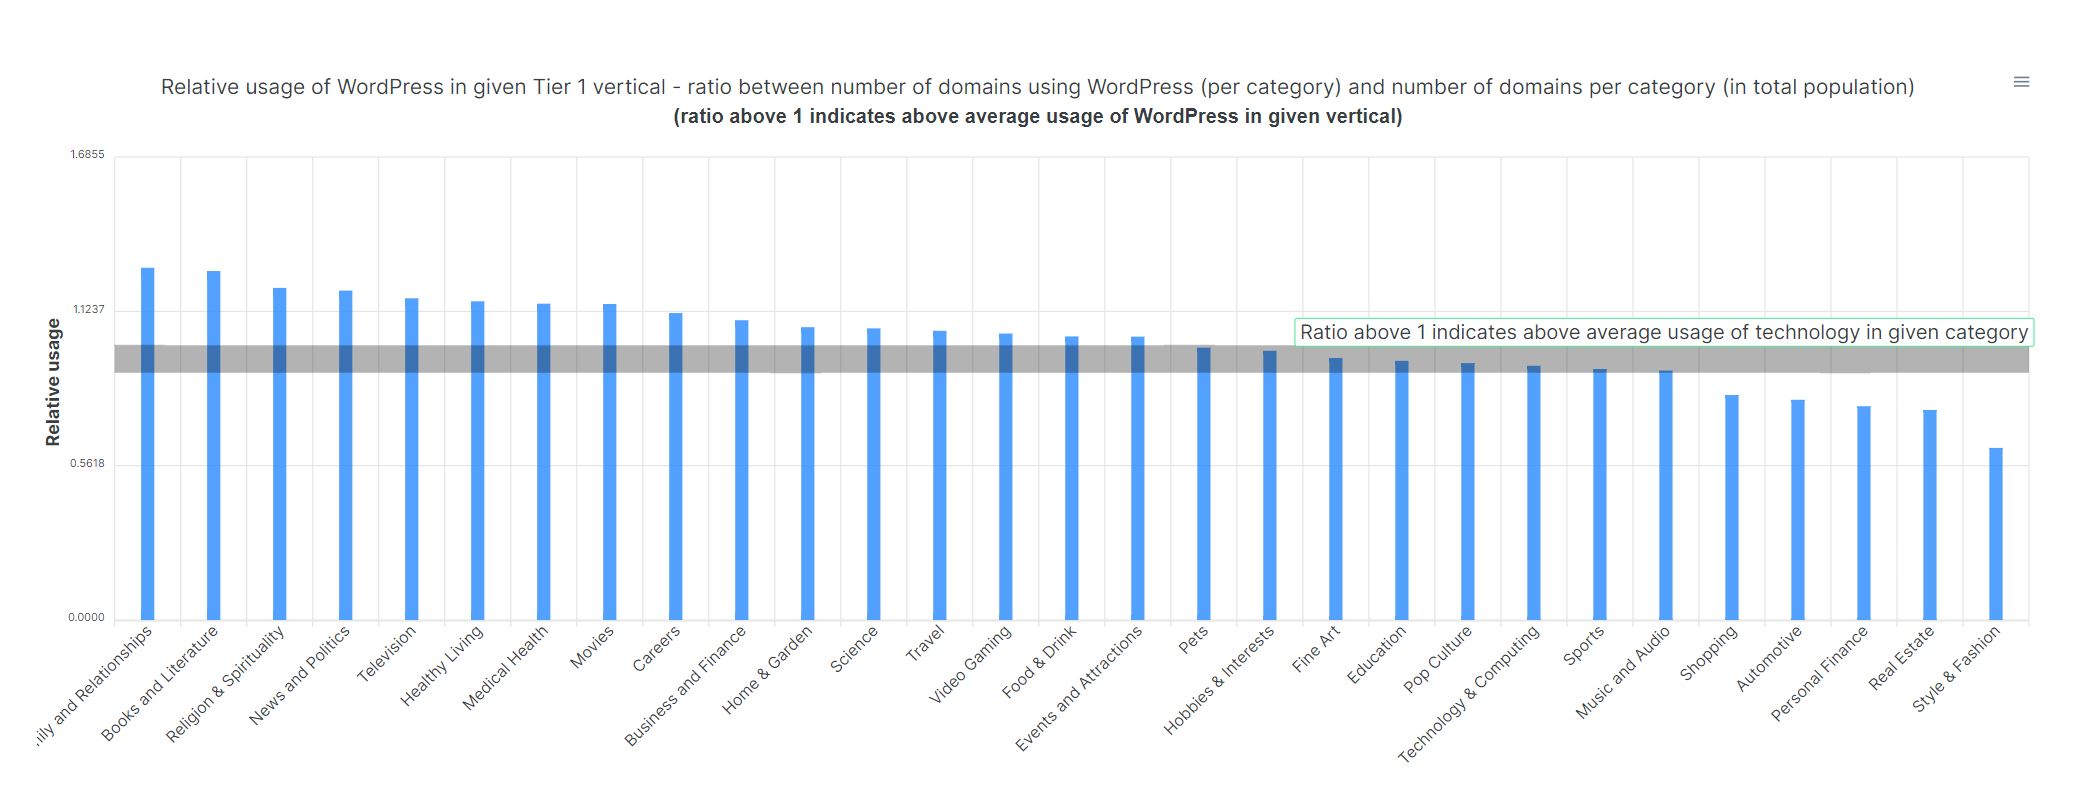 Wordpress is one of technologies with most balanced distribution across categories, with no clear verticals where it is used very much above average.
By subscribing to our platform, you can do the same analysis for thousands of technologies that we cover.
See Plans
There are further valuable tools that we offer as part of the analysis above.
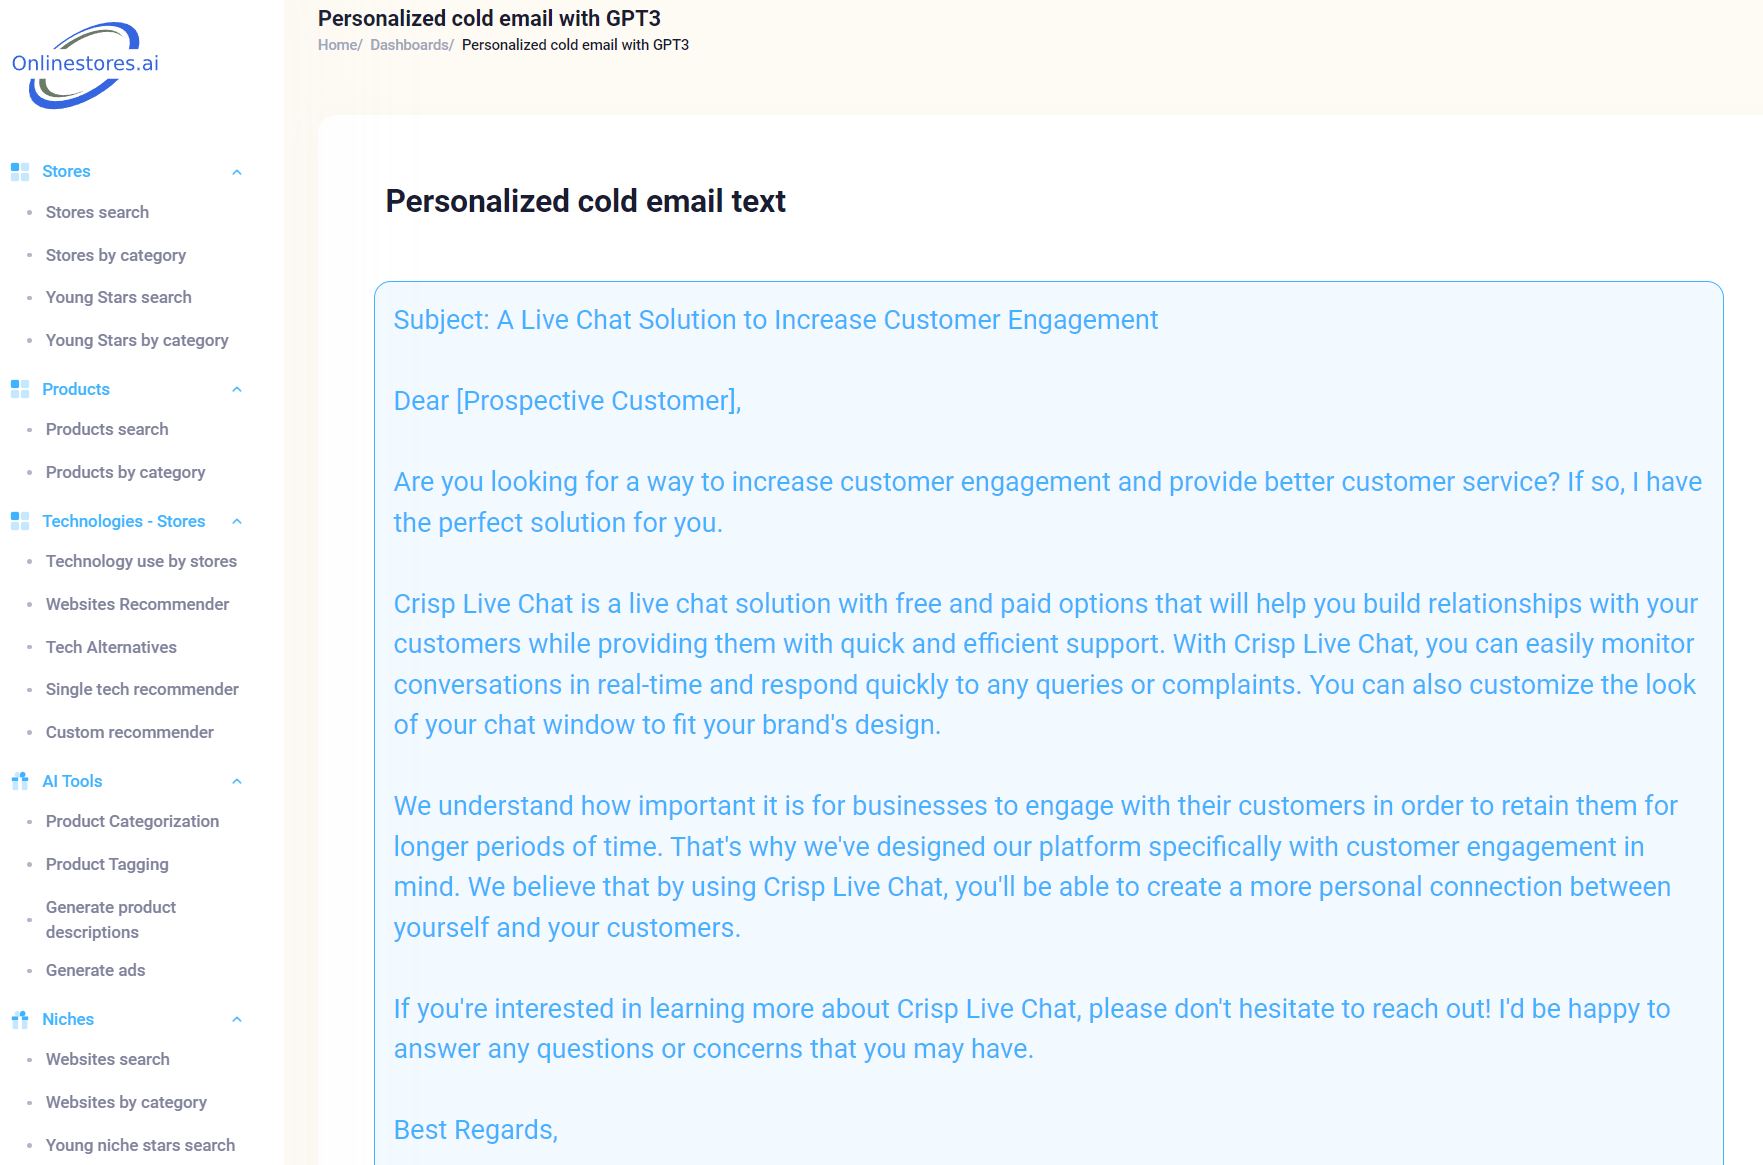
We also provide you with cold email generation using GPT3 engine, fine tuned on description of each technology.
If you are technology/Saas owner or other user, you can simply click the cold email button next to the website on our lists and get a cold email that you can send to the website owner, see image:
In case you have own systems for lead generation, you can export our list of websites (highly likely interested in given technology) to Excel, PDF and other formats.
Start using this lead generation tool and get your list of highly interested customers today.
See Plans
If you are interested in stores that are using specific technology, out of 4000+ that we track, you can simply enter the name of the technology in the search box and get the list of stores that are using it, see below an example for technology Modernizr:
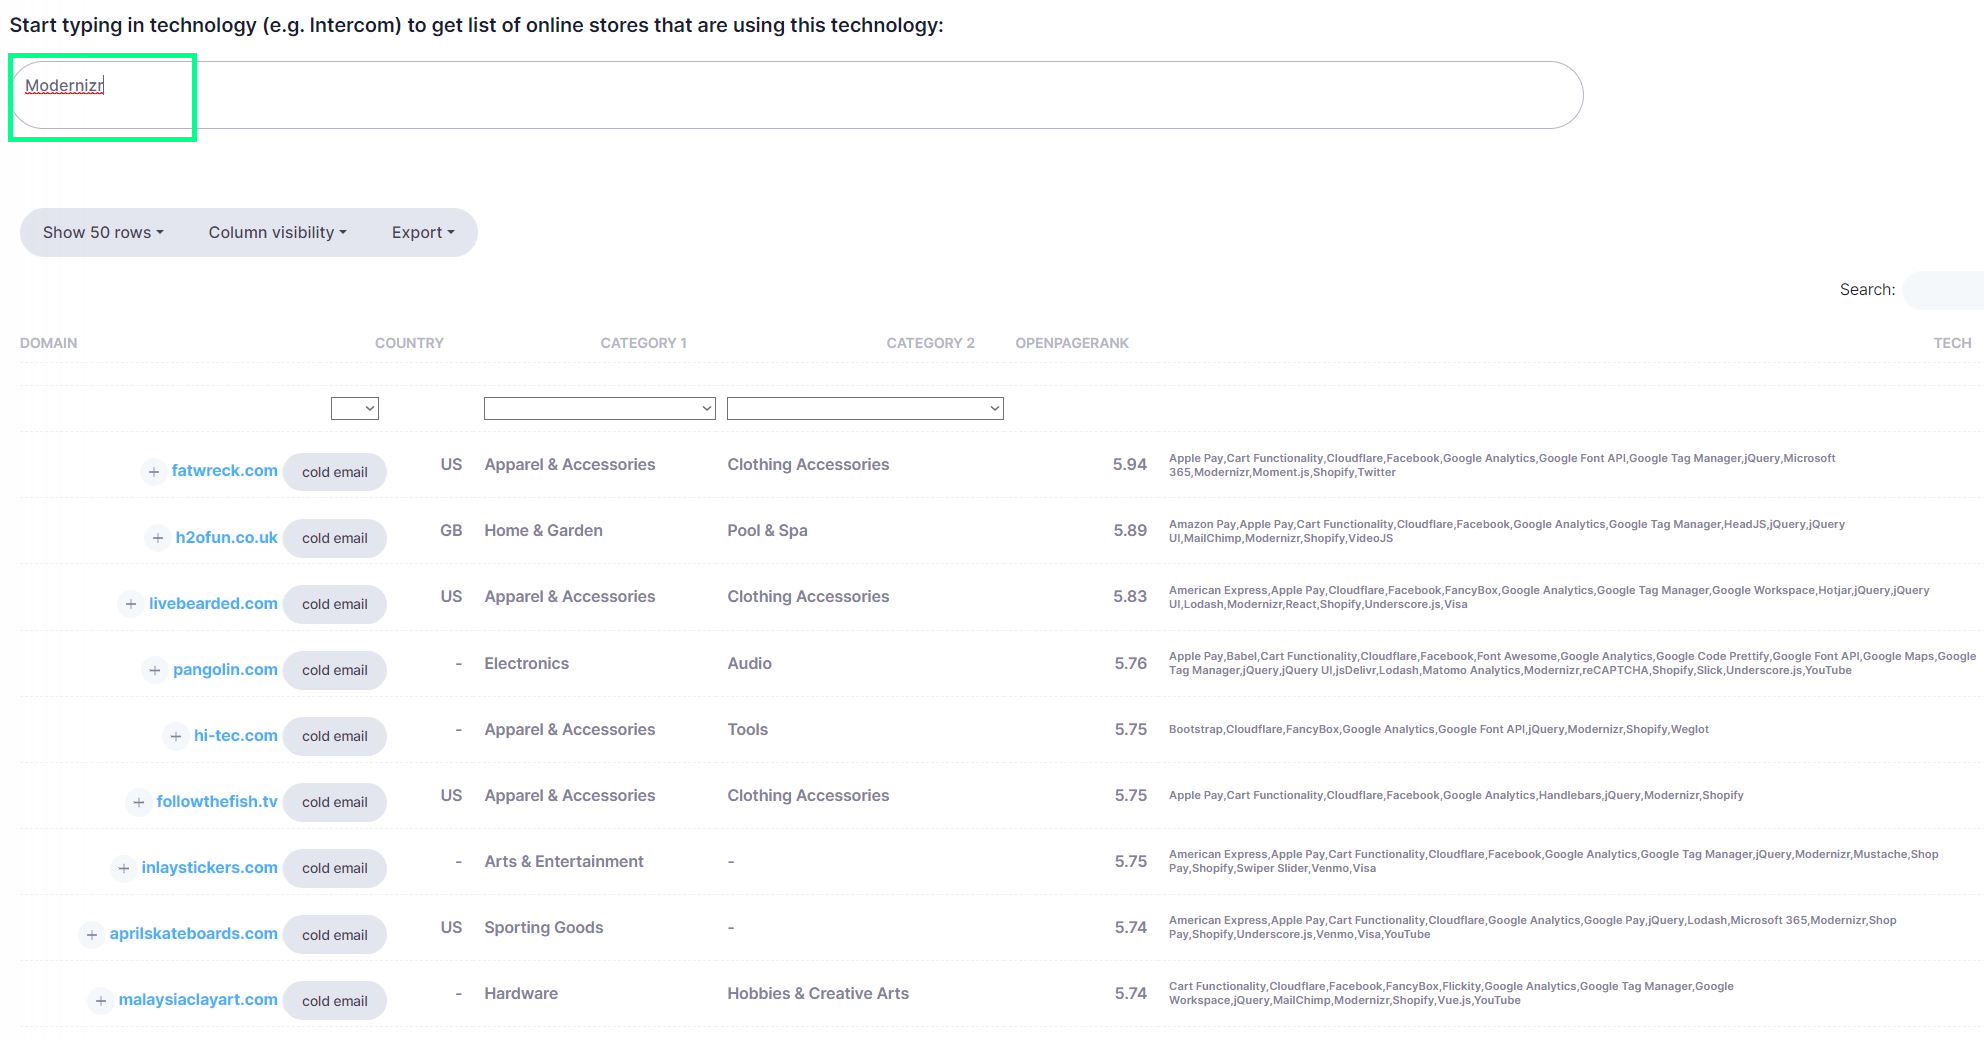
As with other displays of results, there are 20+ metrics and data for each domain in results.
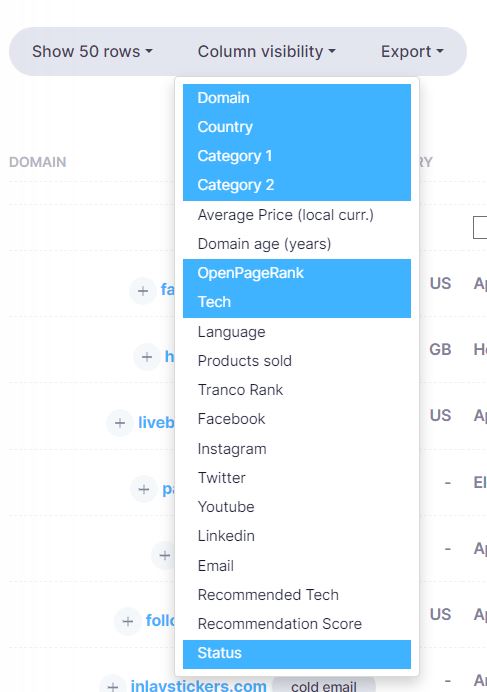
You can filter by country, verticals/categories, average price on store, number of products, domain age, OpenPageRank, Tranco popularity rank, language, and many more:
You can also export the list of stores to excel, PDF and other formats.
We provide technology usage for 1+ million online stores and additionally, for millions of most popular (non-eCommerce) domains.
We categorized 5 million most popular websites on the internet, based on widely used IAB taxonomy.
For each of 5 million websites, we determined many metrics, like OpenPageRank (from DomCop), domain age, technologies used and others, using approach
that we pioneered in 2019 with our SEO focused platform UnicornSEO.
This allows us to offer unique ways to research and find new niche sites.
First, let us say that you are interested in finding young niche sites in the vertical of "Pets" that are attracting great interest, which is usually reflected in above average growth of links and thus high open page rank for given domain age.
In our platform we select the main category of "Pets" and then set maximum "Domain age" to 5 years, followed by
ordering by "OpenPageRank" to get the list of interesting sites in this vertical, see image below:
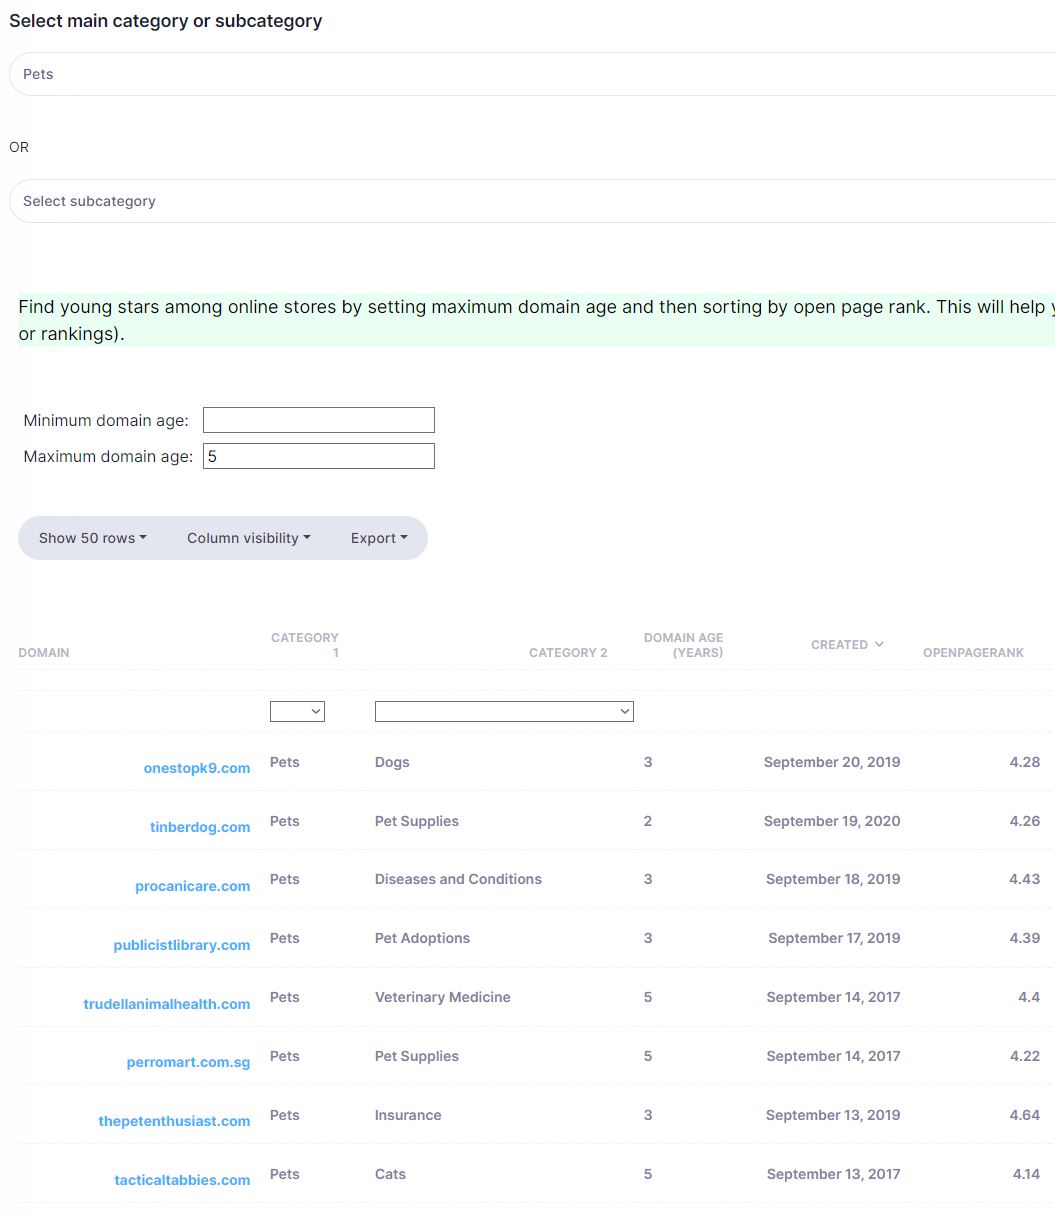
We have found that websites with young domain age and high OpenPageRank are usually very interesting and have great potential.
Second, we can combine the data considered above with our data on technologies used by websites to find another way of finding exciting new niche sites.
For example, we can focus on just those niche sites that use Google Adsense, which is a great way to find sites that are monetized and thus have a good chance of being profitable.
And we can decide on just those sites that are from "Personal Finance" vertical:
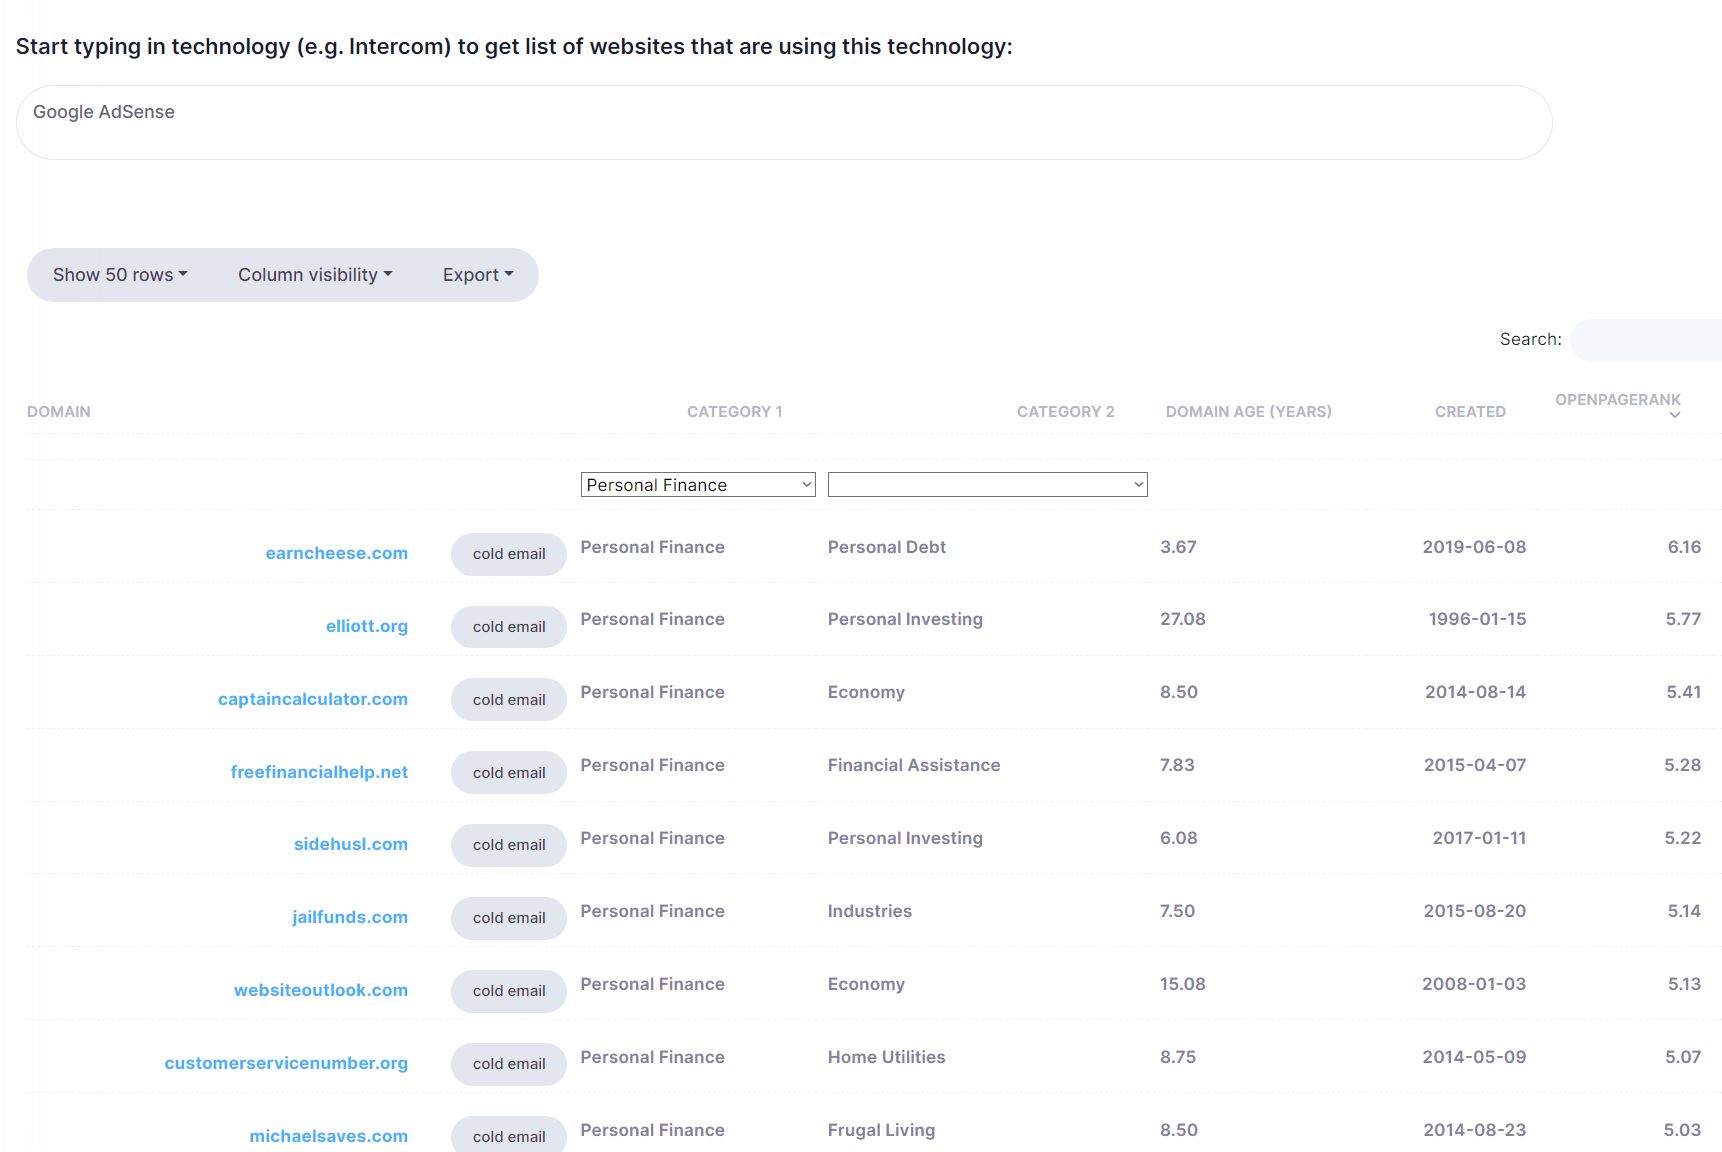
This gives us a list of interesting websites using Google Adsense, from "Personal Finance" vertical.
By focusing again on those with young domain age and high OpenPageRank, one can find interesting niche sites.
That are worth to research further if you are interested in monetizing website in "Personal Finance" sector.
Like this analysis for "Personal Finance", you can do this type of analysis for 439 other main niches.
With our new chatGPT feature, coming in March, you will be able to niche down even more, covering not 440 niches/categories but thousands of different niches.
If you are more used to using Excel or Google Sheets, you can also export list of sites to Excel and do your analysis there. Or export to csv and do analysis with python, etc.
As we already discussed in section 4, our platform allows you to find which verticals/categories are above average / below average users of your technology.
We have classified more than 5 million most popular domains wordlwide, according to IAB taxonomy.
IAB is a widely used taxonomy for classifying websites into verticals/categories.
For these 5 million domains, we also determined which technologies they are using (from 4000+ technologies that we track).
Both data sets allows us to determine which verticals are above average users of any technology, which can be used as part of marketing campaigns by targeting those IAB categories which are above average users.
In addition, this can be combined with our AI recommender for finding more effective partnerships.
Our AI recommender may find that for given technology, a set of other technologies are used together with it.
We can then provide you with lists of websites that are both using these complementary technologies and are from verticals that are above average users of your technology.
Let us consider e.g. WooCommerce, which is a popular eCommerce platform.
This chart shows the relative usage of WooCommerce by verticals/categories, as compared to average usage of WooCommerce across all verticals/categories:
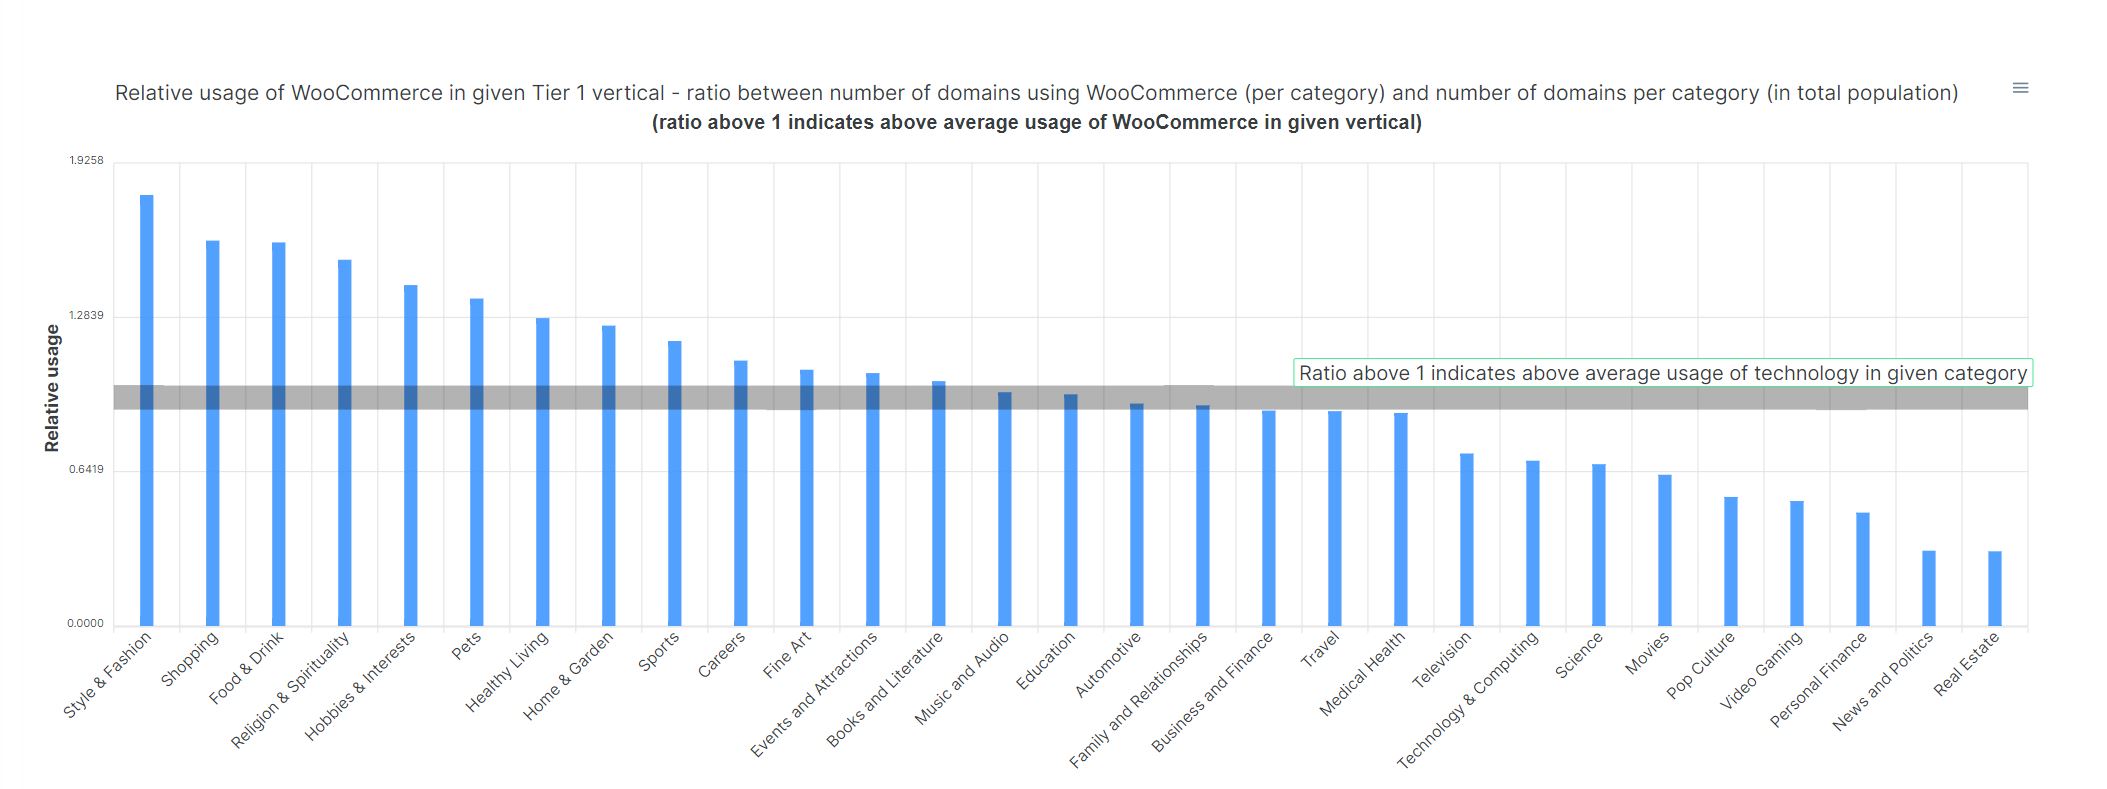
As expected, Style & Fashion, Shopping, Food & Drink are the top 3 verticals, given that they are all eCommerce themed.
Next, let us consider another eCommerce technology - Shopify, this is its relative usage across Tier 1 IAB categories:
You can see that Shopify is used in "Style & Fashion" category 8.1-times more that this category's share in all domains.
Above average verticals are all those above the line with ratio = 1.0, thus also Shopping, Food & Drink, Hobbies & Interests, Pets, Sports, Home & Garden.
The results are in line with expectations, as Shopify is a popular eCommerce platform and one would expect Shopify to have larger presence in the "eCommerce" themed IAB categories.
Here is the chart that shows technology usage across all IAB Tier 1 categories, together with share for each category in all domains:
You can see what are the baseline shares for each category in total population of domains. Style & Fashion is e.g. not in top 5 in general population, but has by far the highest share when only those domains are considered which use Shopify, as already noted above.
We can go into even more in detail, by analyzing relative usage across Tier 2 categories, of which there are 440 distinct ones (we are only showing top 50 for brevity):
Again, above average verticals are quite expected, a selection of top 20 :
They are eCommerce themed categories as one would expect for Shopify.
This section is a continuation of the previous one (you can check it here), where we showed how to find which verticals/categories are above average users of any technology.
Our platform allows our users to get additional insights on any technology, that were gathered from analyzing usage of 4000+ technologies by 5 million most popular domains worldwide.
Let us next discuss the usage of technologies with respect to domain age.
We have gathered data on domain age for more than 5 million most popular domains.
Users of our platforms can use this data to determine how the usage of any technology varies with domain age of websites using it.
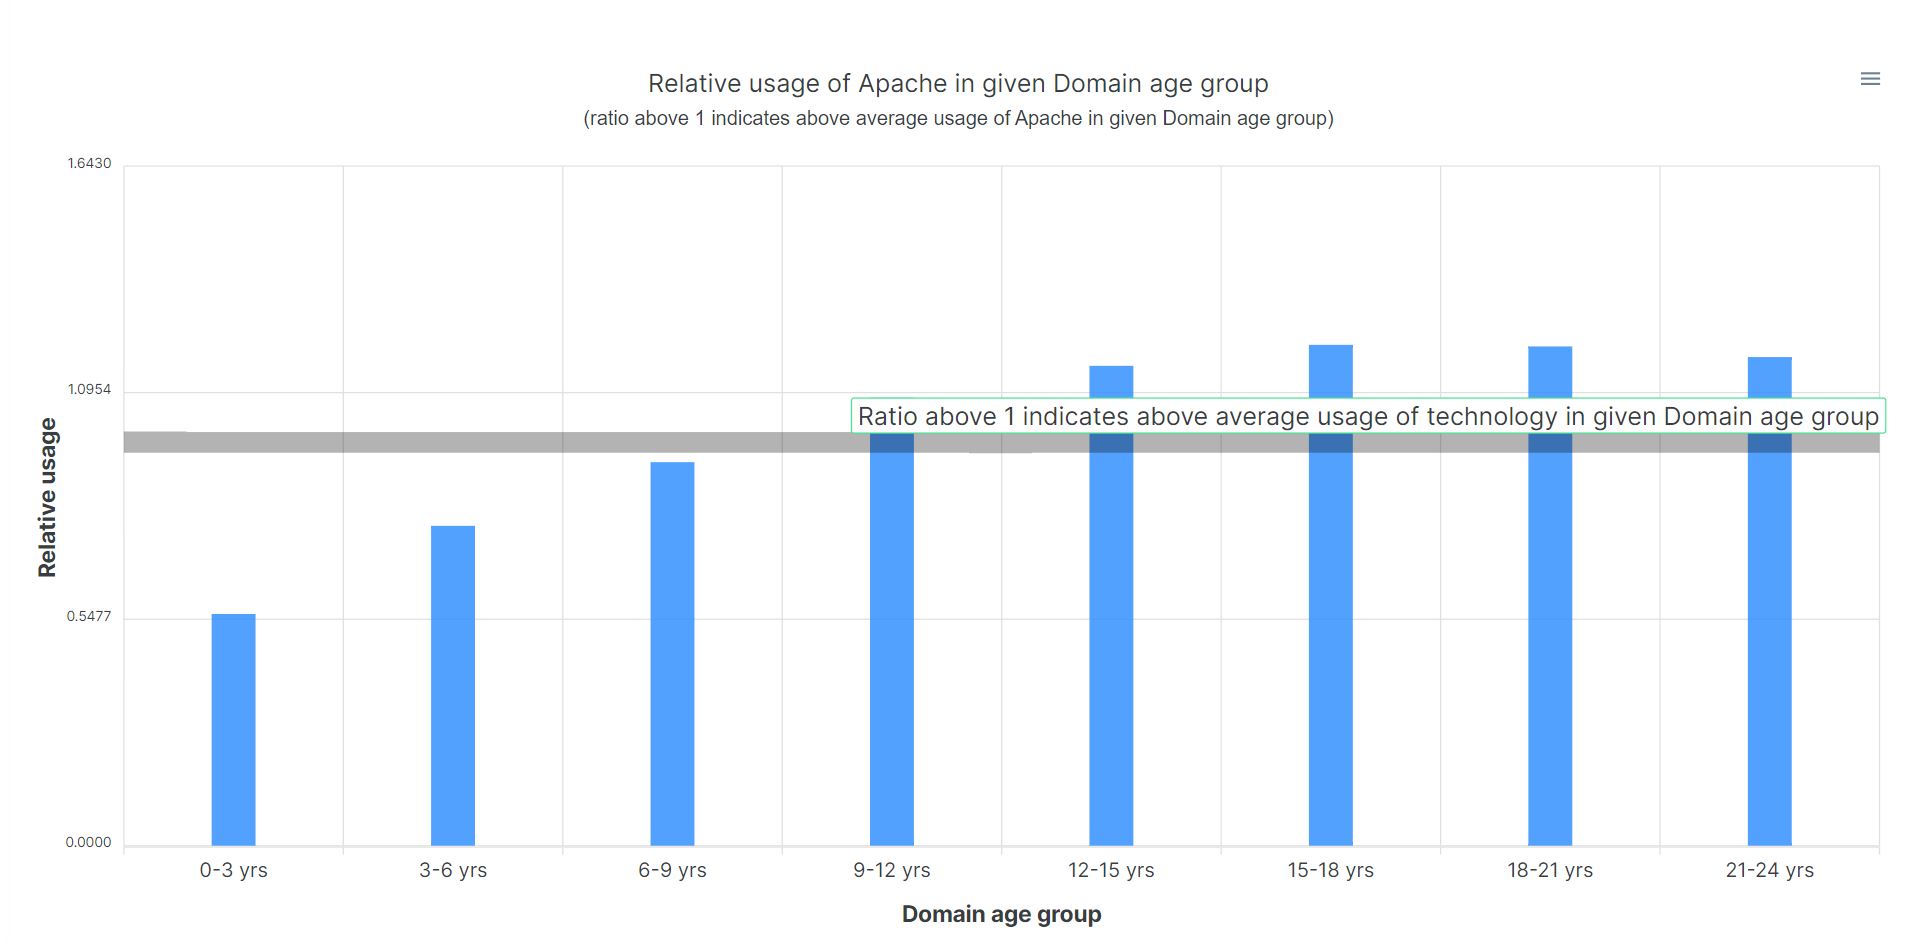
Let us first consider two similar technologies, Apache and Nginx. Here is the distribution of domains using Apache, over their domain age
This is the same analysis, for Nginx.
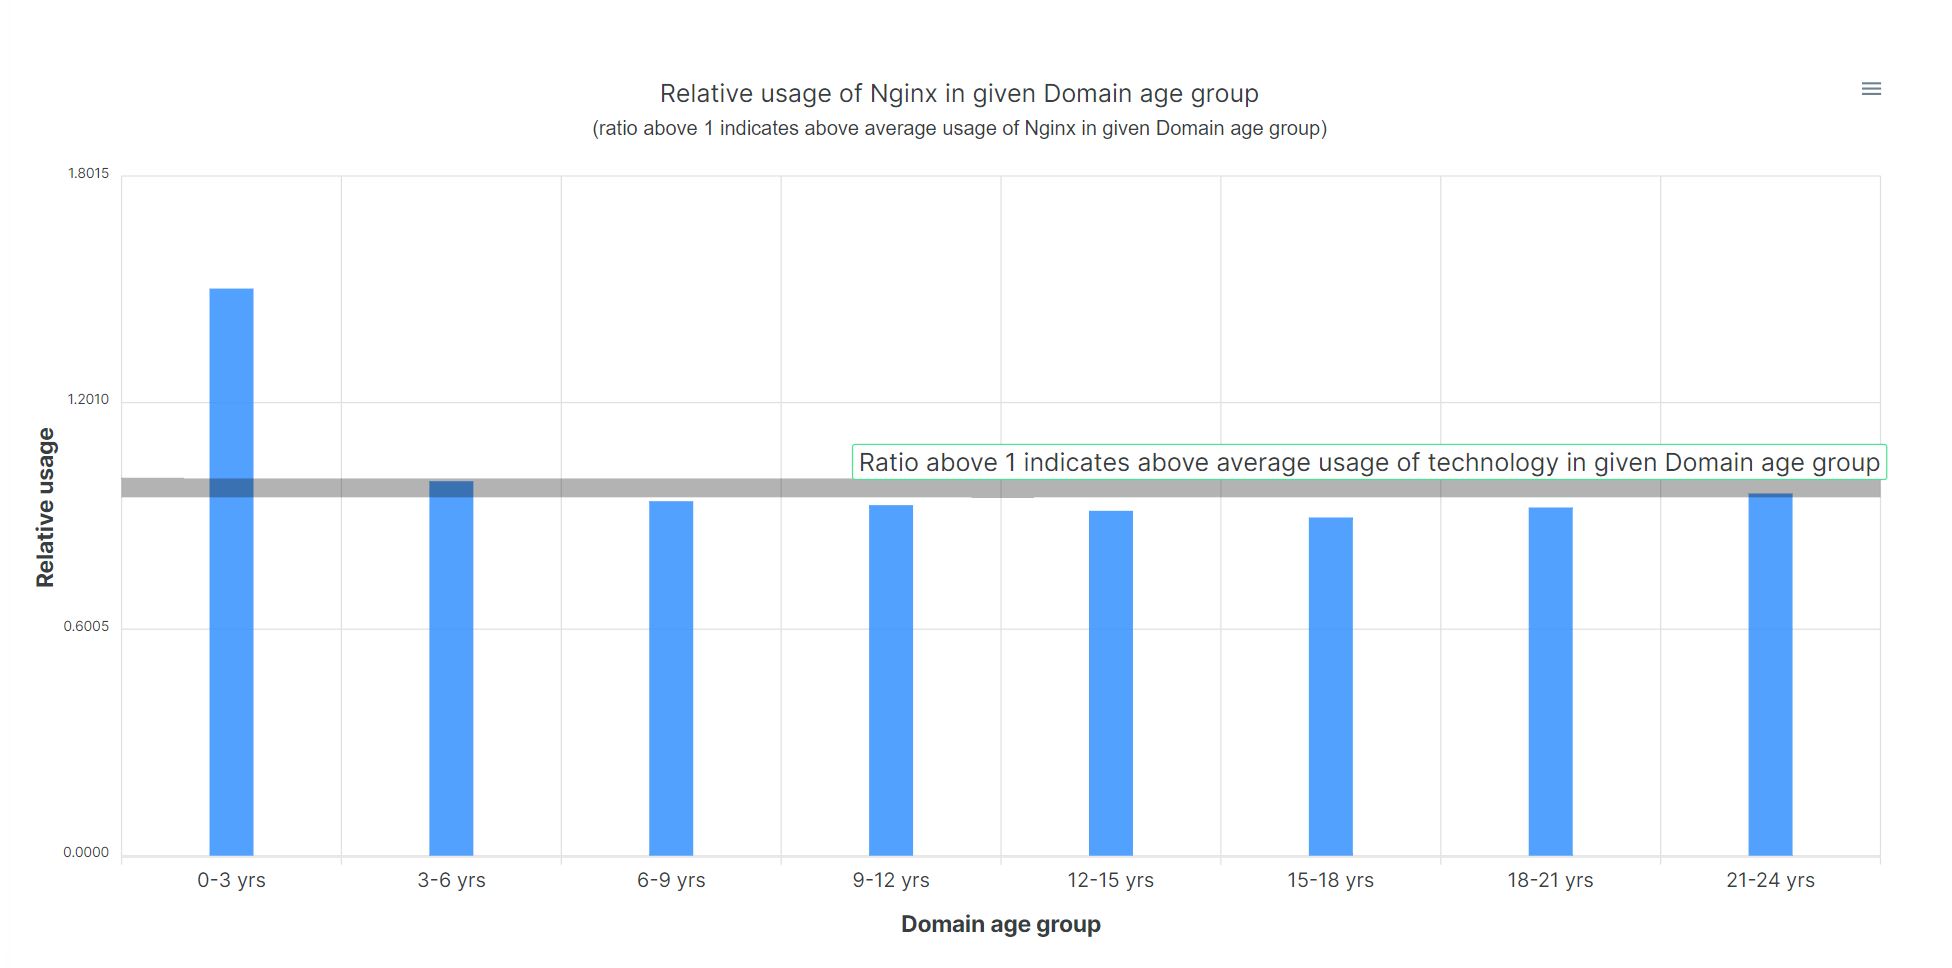
You can see that the usage of Apache is higher for older domains, whereas the usage of Nginx is higher for younger domains.
This is in line with expectations, as the Nginx has been gaining popularity compared to Apache in recent years, which can also be seen both in Google Trends chart
and from news like the following:
Now the World’s #1 Web Server, NGINX Looks Forward to an Even Brighter Future.
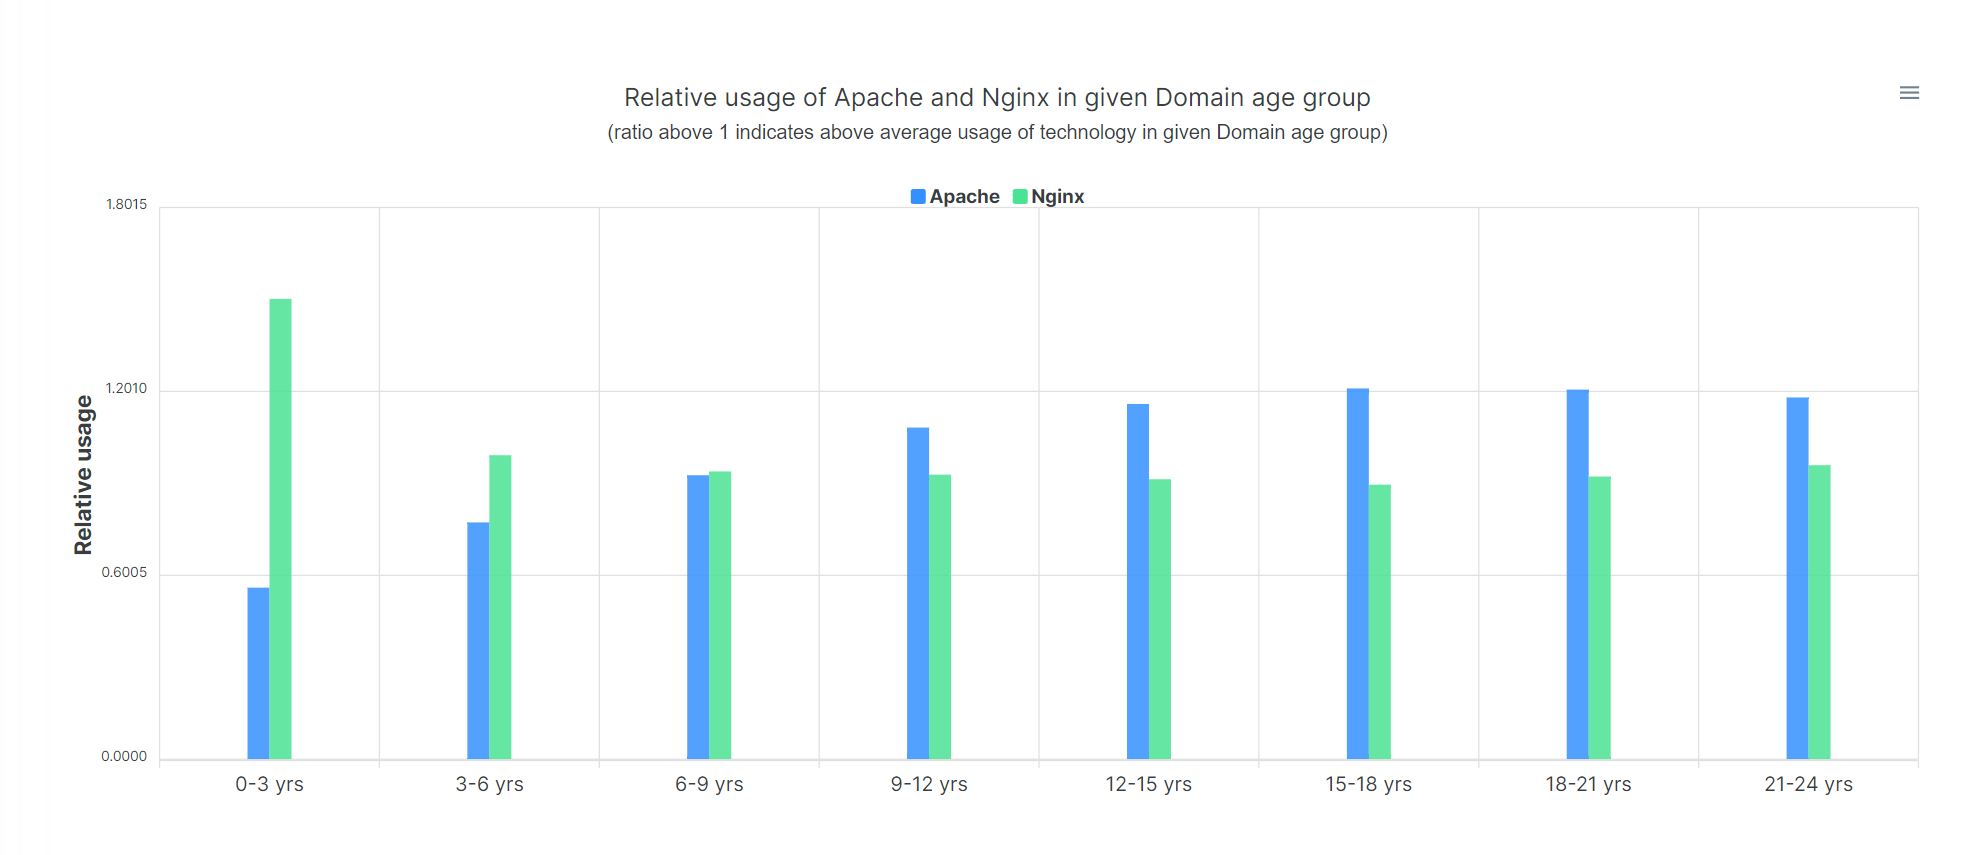
Domain age analysis is an efficient way of finding out which technologies are growing and which are declining in popularity.
We not only provide domain usage data charts for individual technologies, you can also directly compare them, as shown below for our case of Nginx and Apache:
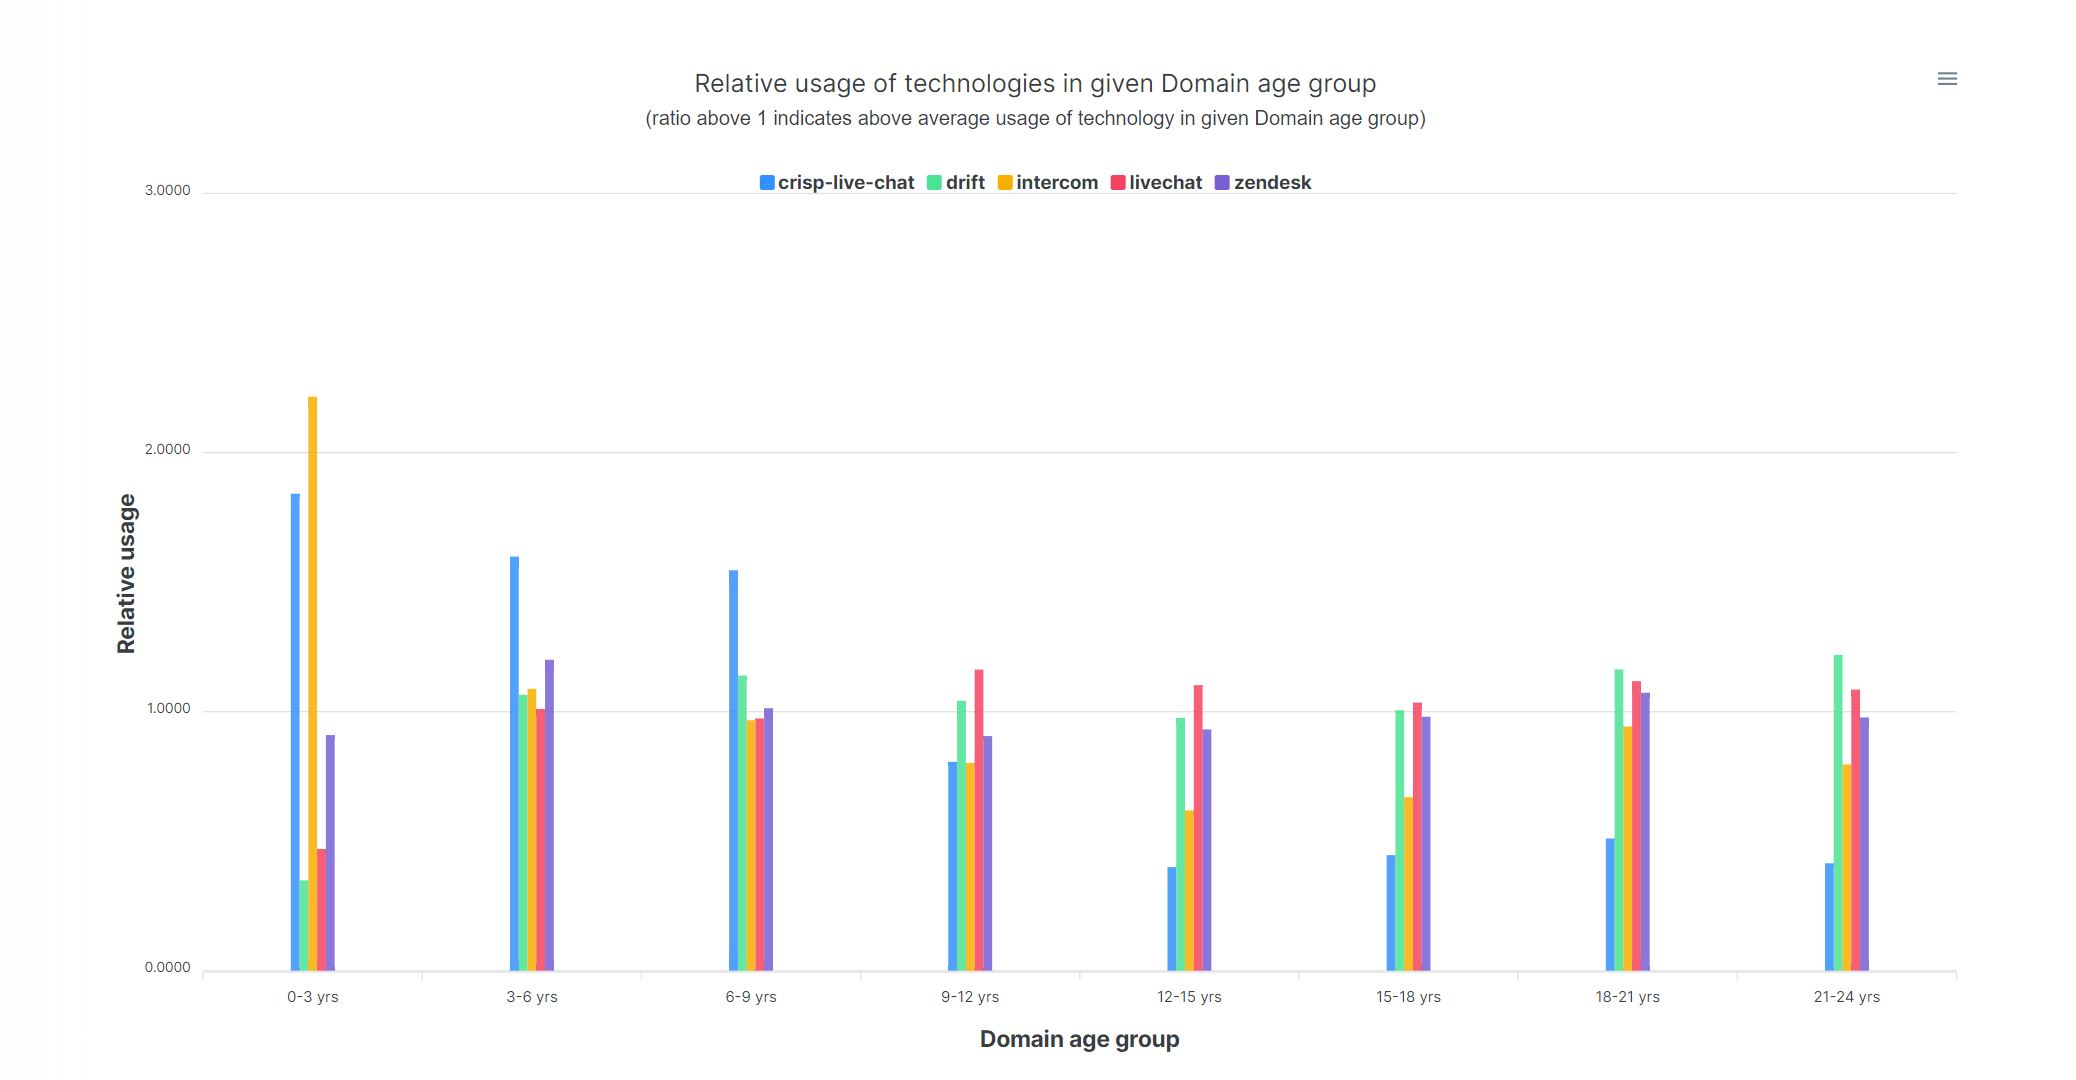
You can also compare the usage of many technologies on same chart, as shown below for Drift, Crisp Live Chat, Intercom, Zendesk, and LiveChat:
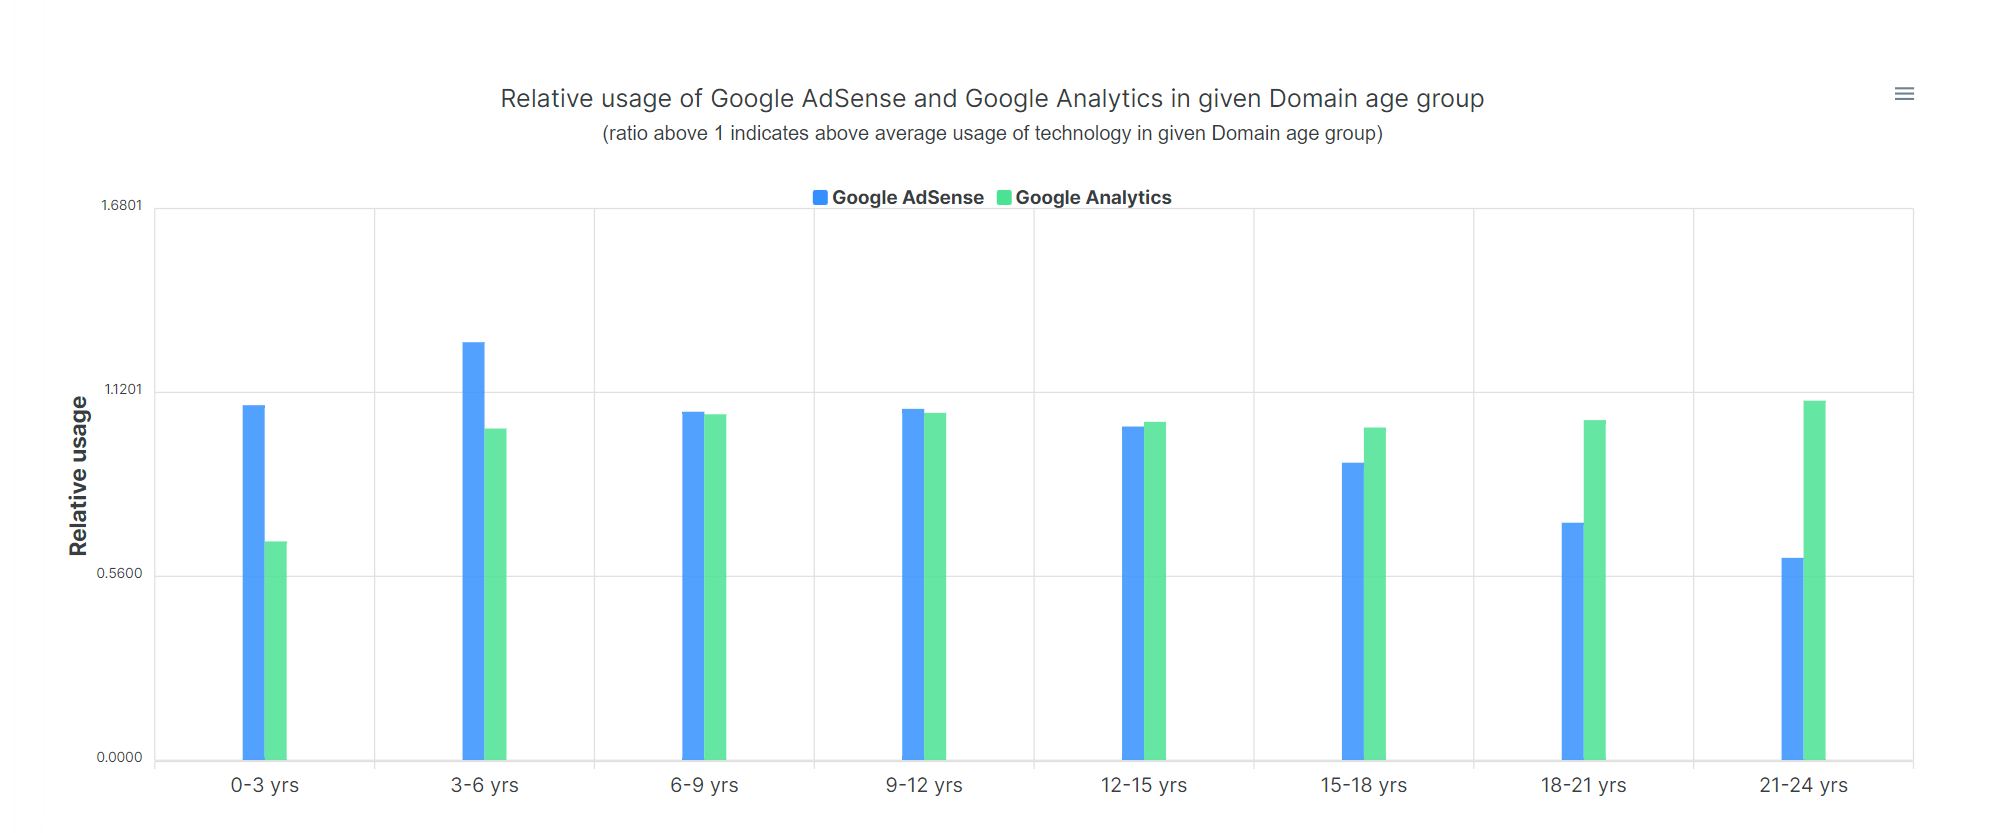
Or let us consider another example, where we compare the usage of Google Analytics and Google Adsense.
One would expect that Google Analytics is less used by very young domains (on average) as they do not have yet enough traffic to need Google Analytics to track visitors.
On the other hand, Google AdSense may be used more by younger domains, as monetizing their traffic is a quick way for a lot of new domains to earn money and because older domains may find other sources of revenue.
Both of these expectations are confirmed by the chart from our platform:
This are only a few examples to illustrate the value of our platform for Saas/Technology owners and their employees.
They can use our platform to see how their technology compares to other similar technologies, for different metrics.
This is an important way of spotting usage/audience "gaps" between their technology and those of their competitors, which can be used to improve their technology and/or marketing.
Let us continue with our analysis, but this time focusing on popularity of domains.
We measure popularity aspect of technologies by their usage by the top 1 million most popular domains worldwide.
The latter list is obtained from the well known research platform Tranco (see more: https://tranco-list.eu).
We have determined which technologies these top 1 million domains use, which allows us to analyze how a given technology is used across these domains.
First, let us consider technology of Apache, here is distribution of domains using Apache, over popularity groups: 1-100000 denotes the group of 100,000 most popular domains,
100000-200000 denotes the group of domains that are ranked from 100,000th most popular to 200,000th. And so on.
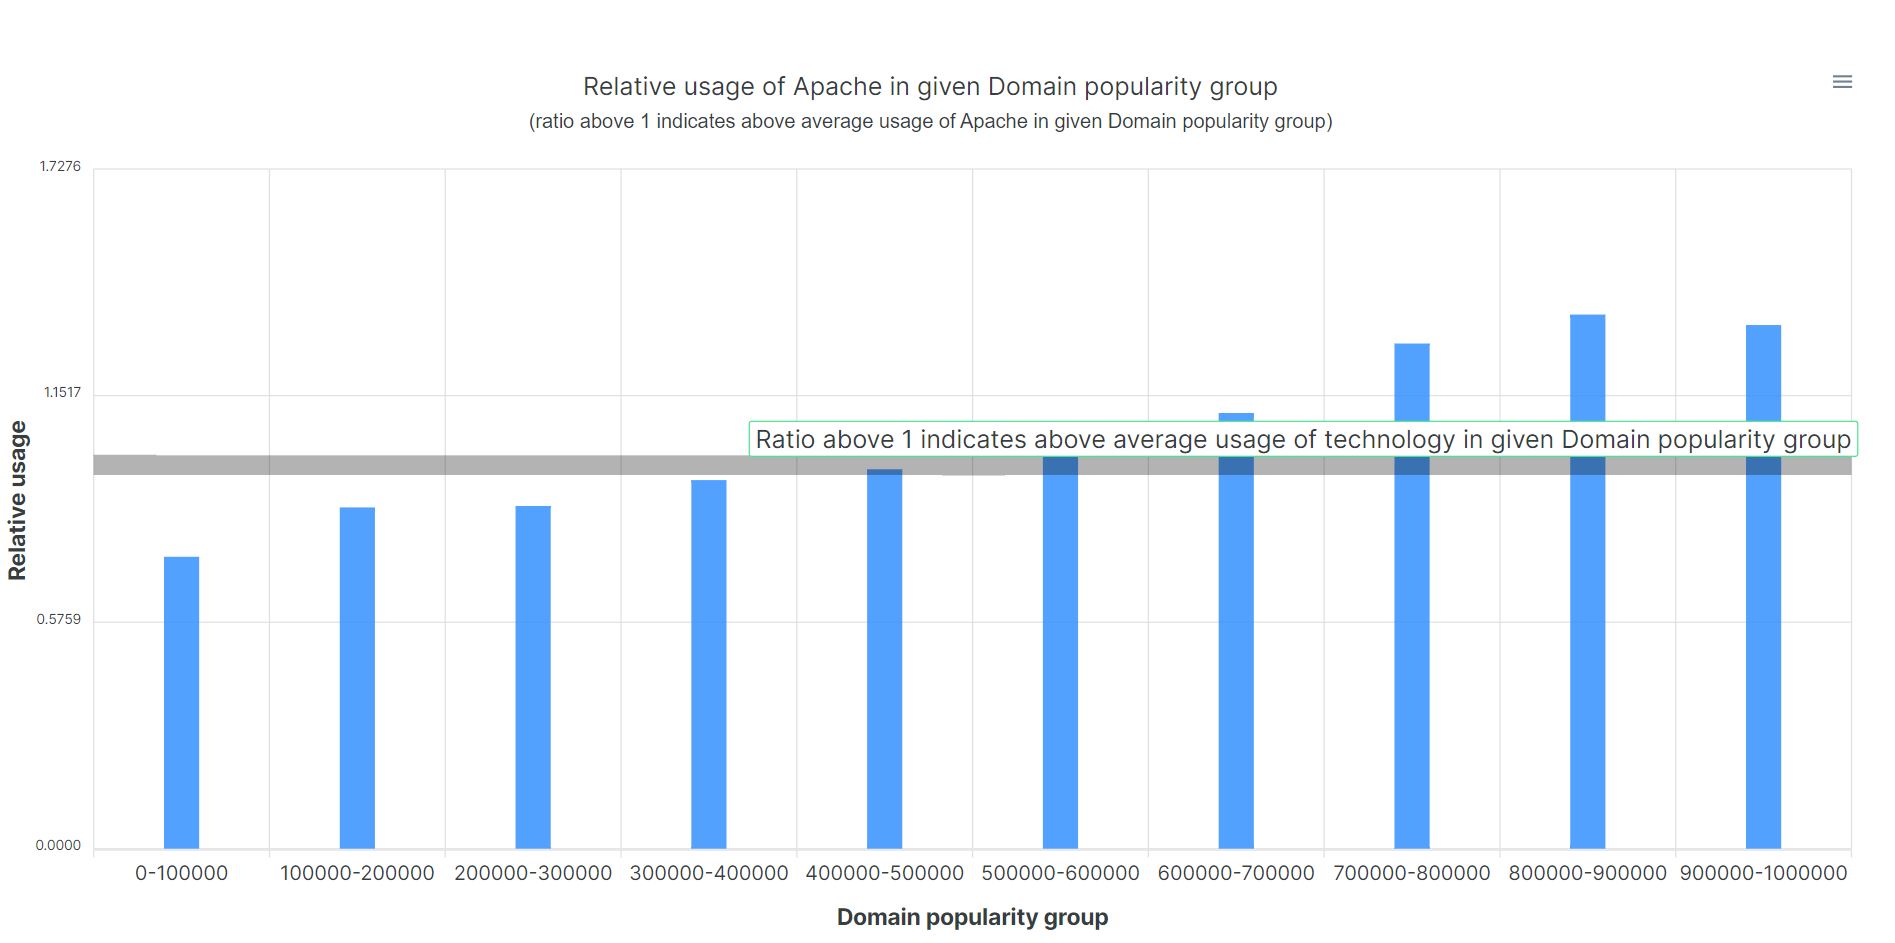
You can see that Apache is less used by the most popular domains (top 100k) and more used as we progress down the rank of popularity.
Let us next consider the usage of React, which is a popular JavaScript library. Here is the distribution of React, over popularity groups:
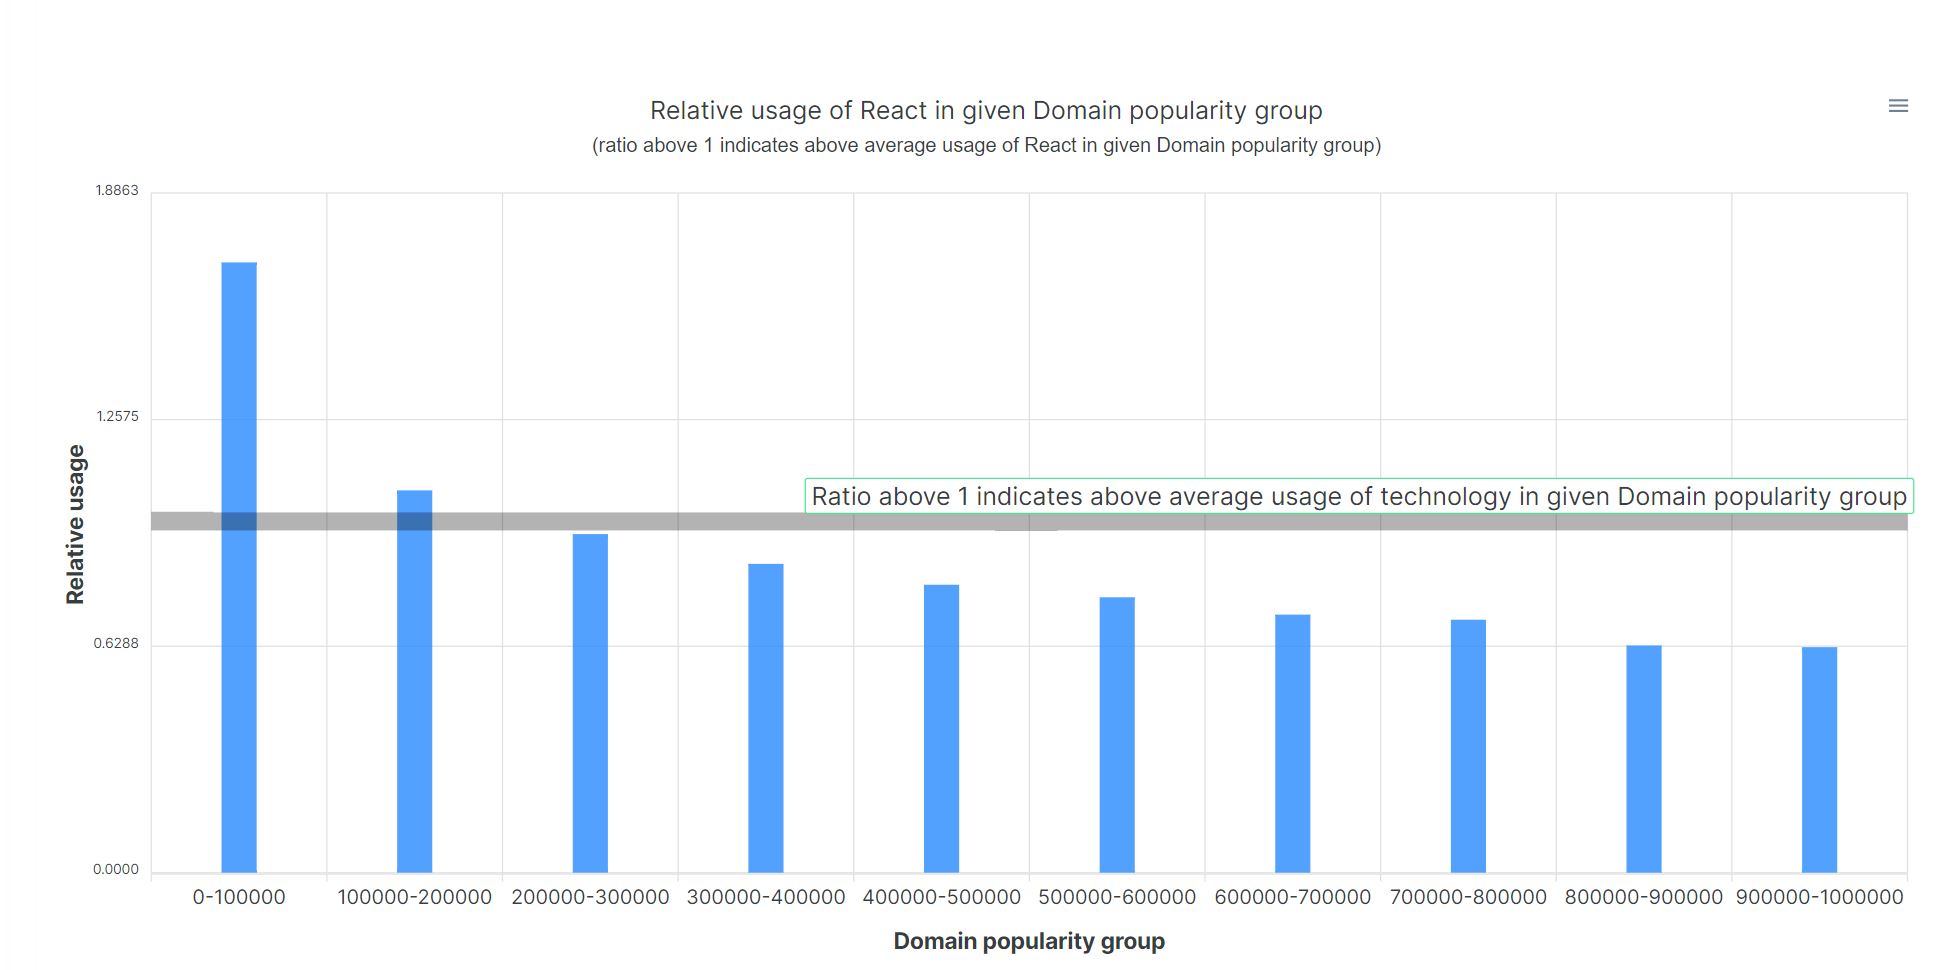
You can see that the usage of React is much higher in the top 100k most popular domains and more or less linearly decreases as we move down the popularity groups.
One reason for this is that React is more difficult to implement and more needed for complex, large websites, with a lot of visitors.
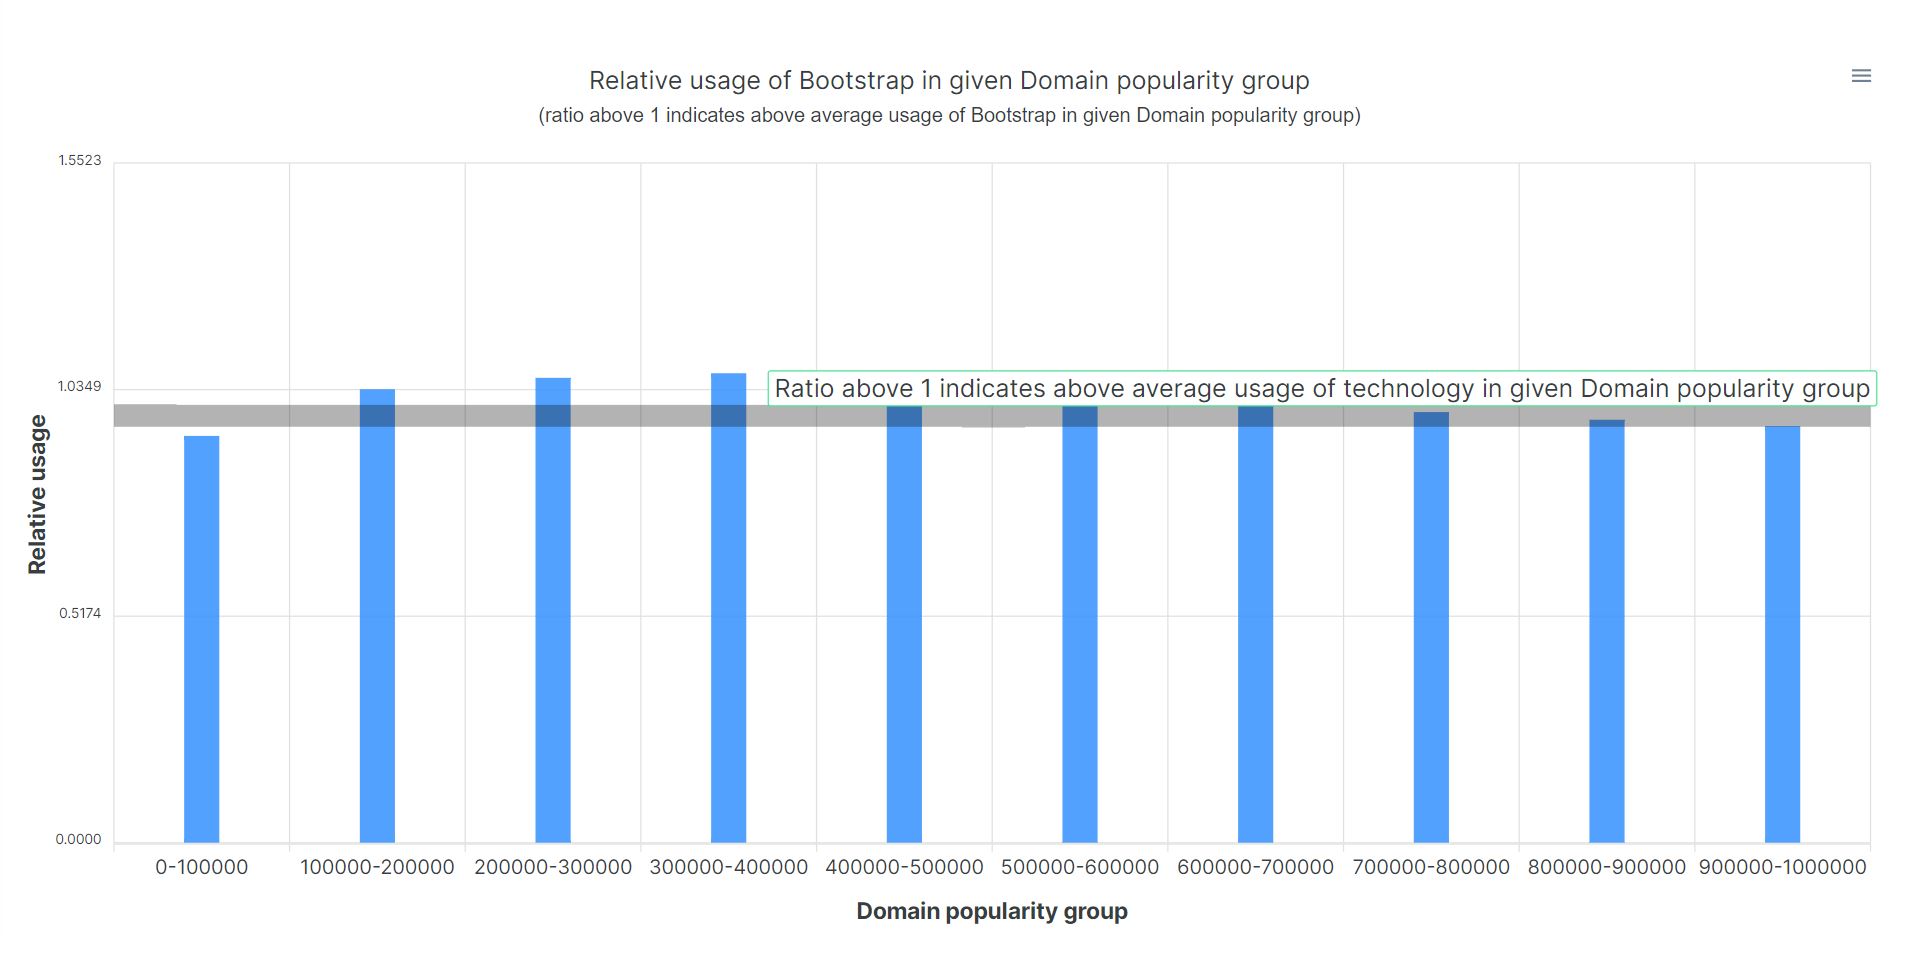
Another widely used technology, Bootstrap, which is much less difficult to set up on website than React, has a much more uniform distribution across popularity groups:
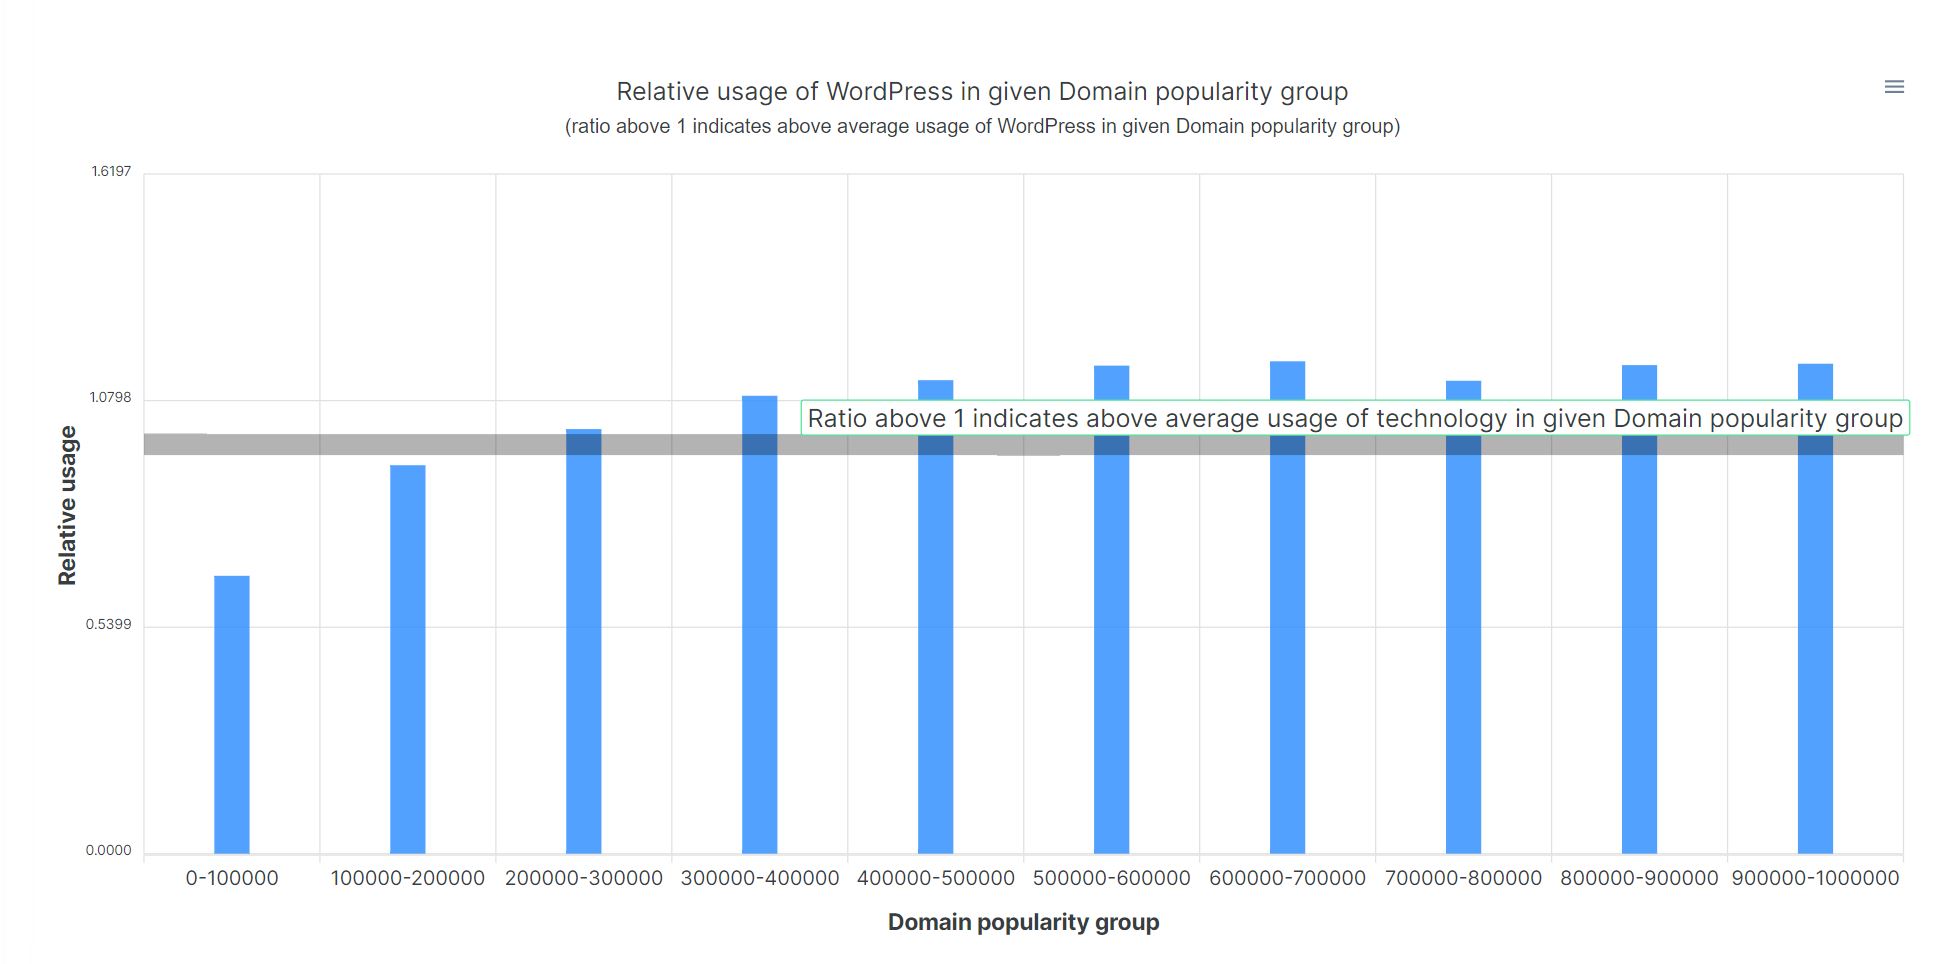
Next, let us consider Wordpress, our analysis chart below shows it is a bit less used for the top 100k most popular domains.
Next, let us turn to country analysis. The following analysis will be based on a subset of around 1 million online stores for which we determined its country.
Here is the distribution of domains using Nginx, over their country.
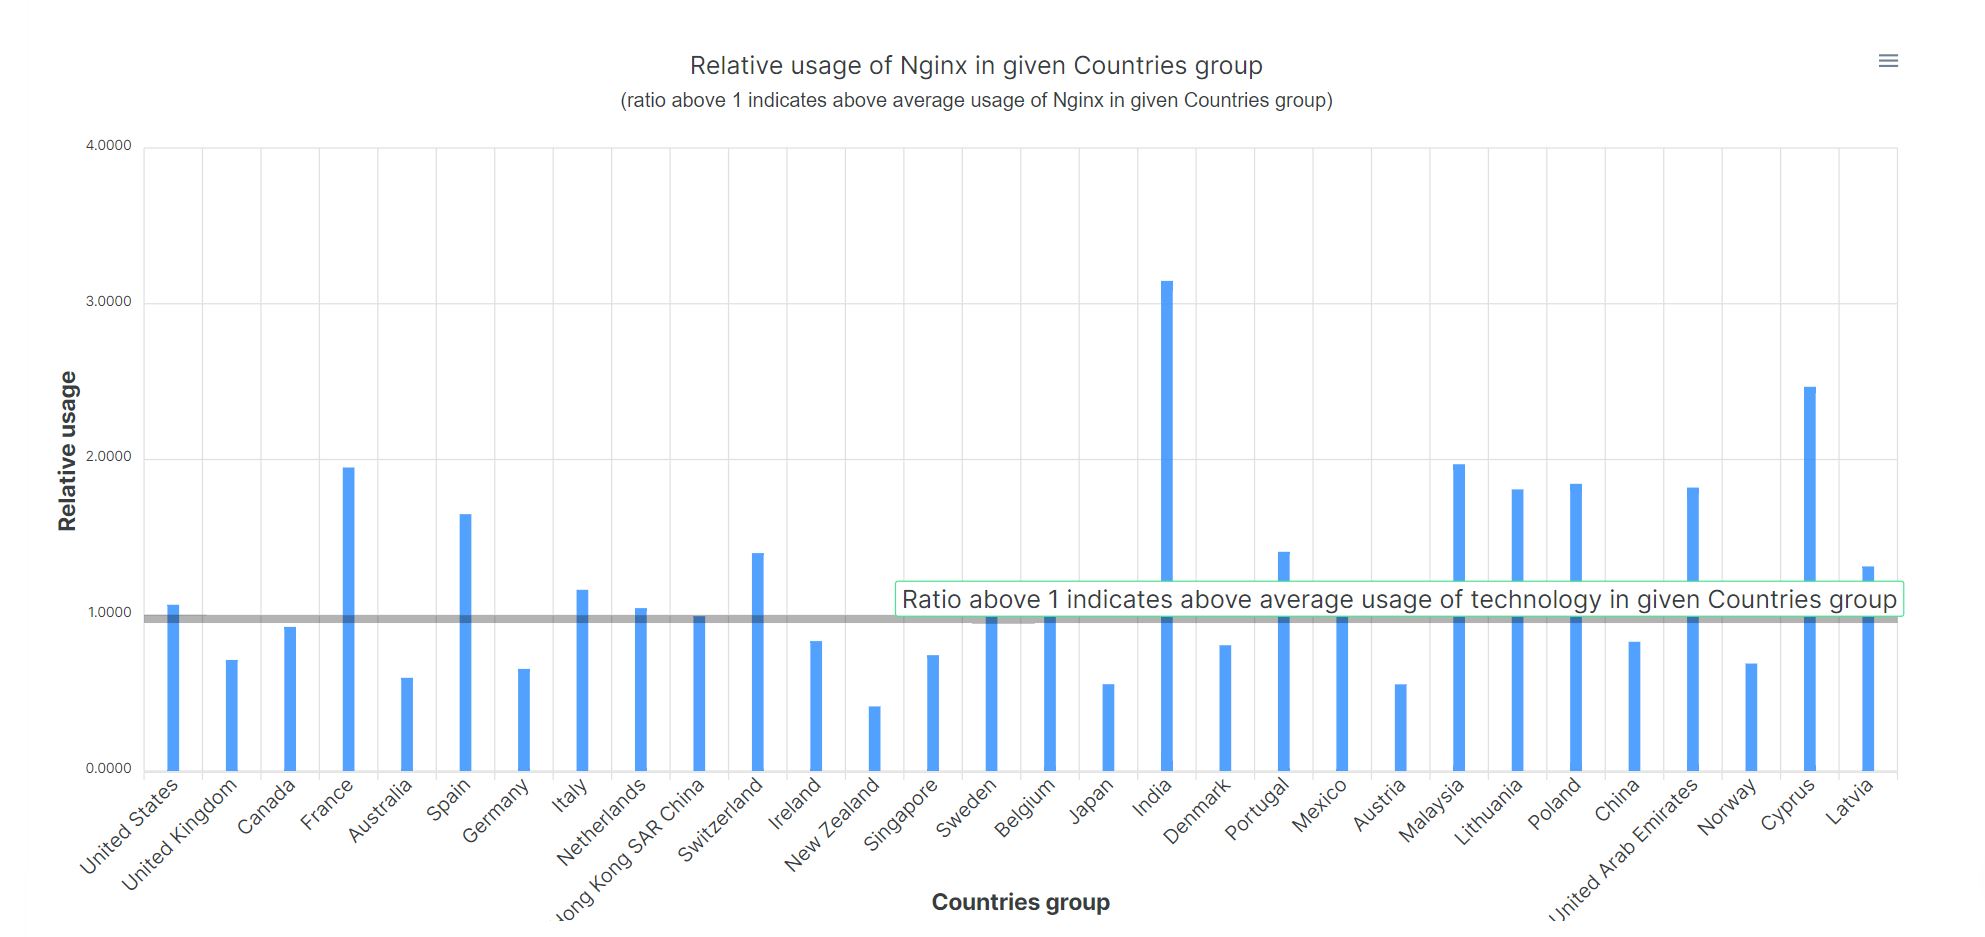 Nginx is very popular in India in segment of online stores.
An important part of consideration of opportunity for a product group is the difficulty of ranking for it.
To determine this, we obtained search engine rankings for each of 60k product group keywords, then
computed the average OpenPageRank for top 10 ranked results for each keyword.
As OpenPageRank is the measure of SEO backlink strength of domain, this metrics allows us to determine the average difficulty of ranking for each product group, from perspective of backlink profiles.
Let us select the product group "Electronics" on platform, and then sort by "OpenPageRank" in descending order.
This is control case, to see the product groups that are most difficult in terms of SEO.
These are some of the most difficult product groups to rank for:
Now let us sort by "OpenPageRank" in ascending order, to find the product groups least difficult to rank, in terms of backlinks required, adding a few such products:
For each of around 60,000 product groups, we have determined 5 year trend of its search volume.
By selecting specific category or by searching for specific keyword in product name, and then ordering by 5 year search volume trend,
you can find highly viral products within specific category or field.
Let us select the Tier 1 Category of "Home & Garden", and then sort by "5 year trend" in descending order:
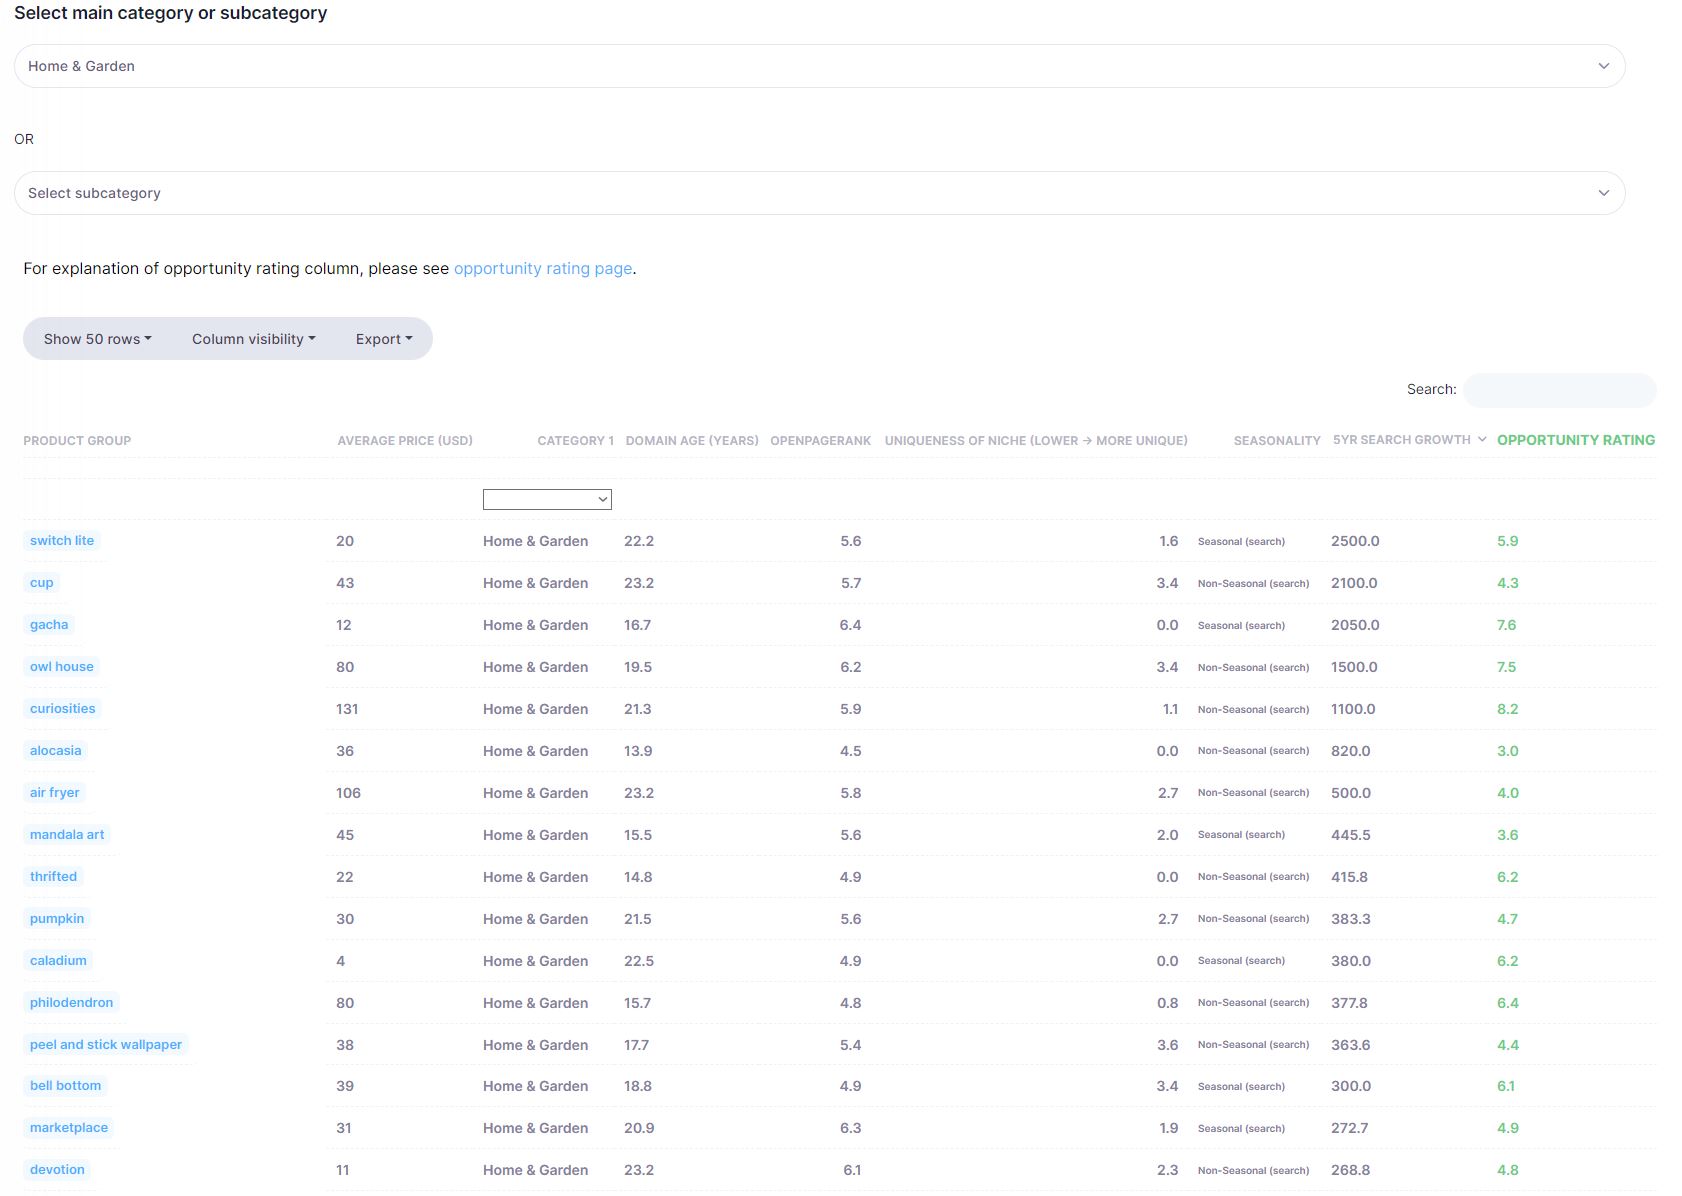
By going through the list, we can find a lot of interesting products in this category, such as:
and many more.
We have determined usage of technologies by millions of websites and also categorized them, based on widely used taxonomy of IAB.
This allows us to determine the top Ad Monetized sites, by category / niche.
Let us select e.g. technology of Google AdSense and then display sites using it, followed by filtering on Personal Finance category.

There are many thousands of websites in our dataset that are using Google AdSense and are from Personal Finance category, the number shown depends on your plan.
This is only one category, you can filter by 439 other categories, to find top Ad Monetized sites, in each niche.
With our new chatGPT feature, coming in March, you will be able to niche down even more, covering not 440 niches/categories but thousands of different niches.
And export the list of sites to CSV, PDF or other formats, for further analysis.
See Plans
Our platform helps identify those websites/clients that are most likely to churn for given technology.
We offer two distinct methods for churn prevention.
The first method is based on usage of technologies by websites/clients in specific category. We have determined usage of 4000+ technologies by millions of websites and also categorized them, based on widely used taxonomy of IAB.
This allows us to find those verticals/categories of websites/clients that are much less likely to use given technology than clients from other verticals/categories.
E.g. you can see in chart below that domains/clients in category "Style % Beauty" are 8-times more likely to use Shopify compared to baseline:
Clients in this vertical are thus much less likely to churn.
On the other hand, clients in category "Books and Literature" are less likely to use Shopify than baseline.
So this is one of verticals where one can focus on churn prevention.
The lower the ratio of category in the chart, the more likely it is that clients in this vertical are likely to churn for given technology.
The chart above shows distribution for Tier 1 categories of IAB taxonomy.
But we offer the same analysis on even more detailed level, for 440 categories of Tier 2.
So you can even more precisely identify those clients that are most likely to churn.
Here is the chart showing ratio for top 50 categories for Shopify (50 is shown for easier reading, table contains all 440 categories):
This is only one basis for churn prevention that our platform offers.
The other approach is based on AI recommender that we trained on usage of technologies by millions of websites, with more than 100 million data points.
It can thus spot if some technology A is unlikely to be used in combination with some set of technologies used by website/client Y.
This client is thus highly likely to churn.
By applying AI recommender for thousands of technologies over millions of websites, we can thus identify for each technology those clients that are most likely to churn for this technology.
Our AI recommender outputs for given technology the list of websites that are most likely to churn, ordered by the probability for this occurring.
We believe this innovative and AI based approach to churn prevention is important way to prevent churn for your company.
See Plans